The market's performance yesterday strikingly illustrates the kind of trading dynamics that are especially hazardous to day traders. Strongly coherent trend days such as those seen by the indices yesterday are great if you are correctly positioned and abstain from any attempt to fade against the trend. However in the current environment with many trading desks and funds short from the negativity surrounding the recent employment data and the spike in commodities, the overwhelming bias in the order books from the buy side both instigated and was accelerated by panic buying from those on the short side.
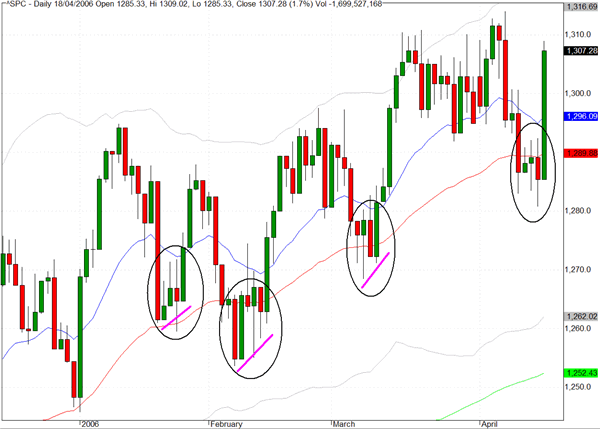
We repeat what we said in yesterday's commentary..."tempering any tempation we have to alter our intermediate view is the fact that the noticeable troughs following the employment reports issued in February and March lead to swift recoveries (including some obvious short squeezes), and we could be carving out another similar trough at the moment."
We have circled all of the troughs that we were referring to and in reviewing yesterday's powerful surge we see the repeat of the pattern we cited, but the urgency of the reversal was quite a bit more than we were expecting.
After such a one-sided market move we will adopt a cautious posture today as many of the individual stock patterns look somewhat unorthodox and suspect.
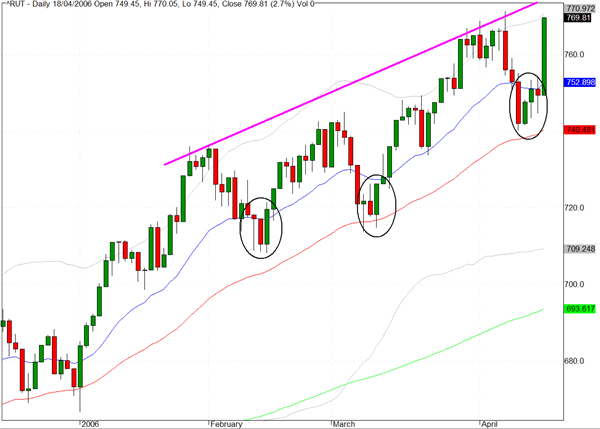
The Russell 2000 (^RUT) put in a stellar performance yesterday rising by 2.7% to reach a new all time high just below 770. The troughs we discussed above are also evident on this chart and we would also draw attention to the significance of the 50 day EMA which has supported all of the movement since the beginning of 2006.
In fact the 50 day EMA coincides almost exactly with the bullish trendline through the lows. And there are still many teaching finance who claim that the markets follow a random walk!
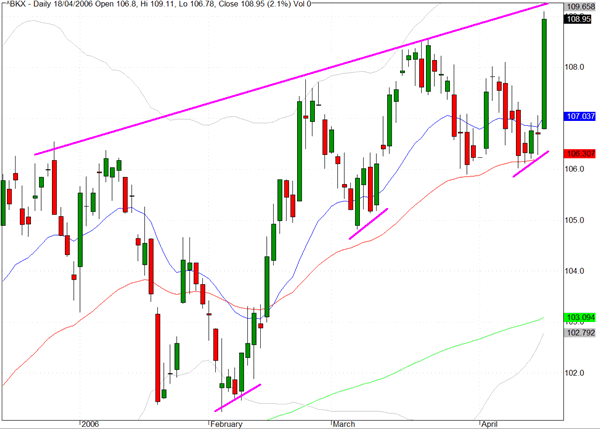
The chart for the Banking index (^BKX) is one of the most revealing from yesterday√Ę‚,¨‚"Ęs trading and once again, in similar fashion to the Russell 2000, we not only reversed dramatically but went on to register a new high.
Just how much further upside is possible is unclear and with increasing volatility in opinion/sentiment about the future course of interest rates we would remain cautious about exposure to the financial sector. Similar comments would apply to the homebuilders which also benefitted from yesterday√Ę‚,¨‚"Ęs more positive outlook on rates (expressed slightly differently, from massive short covering).
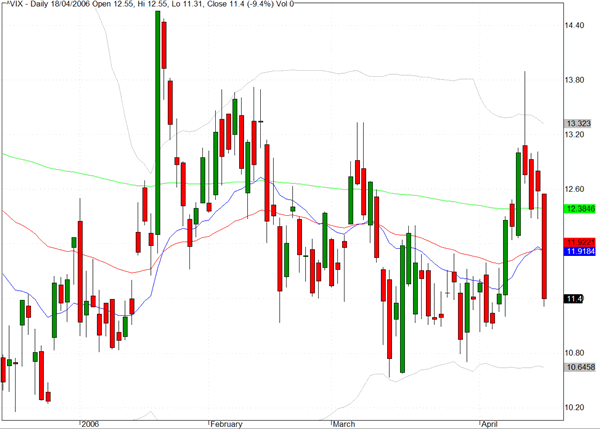
We have included the chart for the CBOE volatility index (^VIX) to reflect the converse of the troughs we have discussed in regard to the index charts. The comments that we made, in the context of yesterday's strong trend day, about the hazards for day traders of the indices apply equally to those trading in implied volatility.
TRADE OPPORTUNITIES/SETUPS FOR WEDNESDAY APRIL 19, 2006
The patterns identified below should be considered as indicative of eventual price direction in forthcoming trading sessions. None of these setups should be seen as specifically opportune for the current trading session.
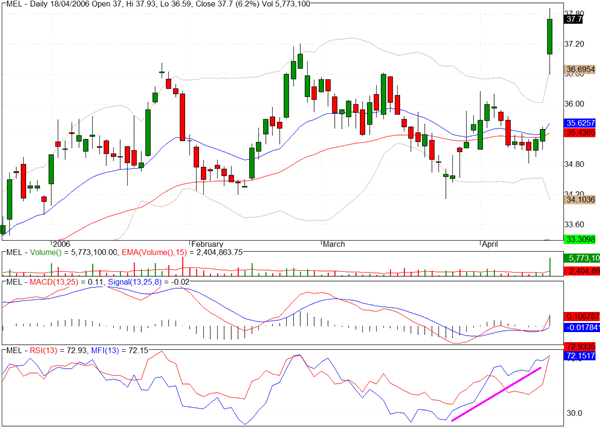
Although we do not see a current opportunity for Mellon Financial (MEL) we thought it could be useful to review the setup that produced yesterday's 6% gain. In reviewing the chart we see the very positive MFI characteristics associated with the relatively stagnant price action before yesterday's breakout.
We are sometimes questioned about the validity of the MFI indicator, and, as with all indicators, there are times when it is less reliable than others, but the pattern we have highlighted is remarkably consistent and one that can be dug out from the Positive Uplift section of our website's daily scans.
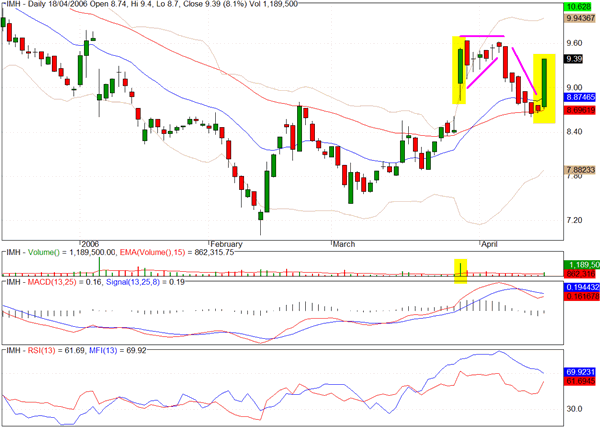
Another chart that we noticed ysterday was one that we featured in our Watch List recently. Impac Mortgage Holdings (IMH) has a pattern that doesn't really conform to the bullish flag pattern as the rising trend line following the flag pole is counter to the normal descending channel pattern. However following that unorthodox rising trend segment the remainder of the pattern, including the volume characteristics, fits the pattern requirements rather well.
The 8% upward move is certainly the desired result, but when you relax the requirements for a pattern that has served you well, there is a risk that you allow through the filter candidates that will not perform as expected.
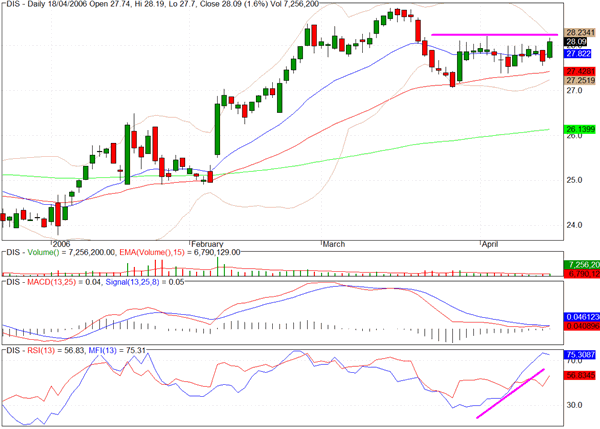
Following on from our discussion of the Mellon chart we would also suggest that similar characteristics are observable on the chart for Disney and a breakout could be imminent.
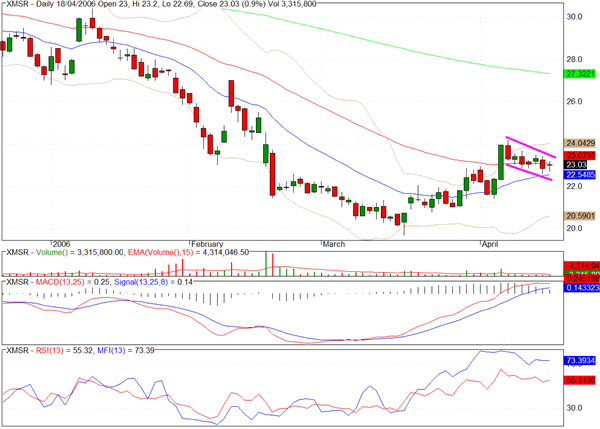
XMSR is forming a rather clear bull flag pattern with the appropriate volume conditions.
Clive Corcoran is the publisher of TradeWithForm.com, which provides daily analysis and commentary on the US stock market. He specializes in market neutral investing and and is currently working on a book about the benefits of trading with long/short strategies, which is scheduled for publication later this year.
Disclaimer
The purpose of this article is to offer you the chance to review the trading methodology, risk reduction strategies and portfolio construction techniques described at tradewithform.com. There is no guarantee that the trading strategies advocated will be profitable. Moreover, there is a risk that following these strategies will lead to loss of capital. Past results are no guarante of future results. Trading stocks and CFD's can yield large rewards, but also has large potential risks. Trading with leverage can be especially risky. You should be fully aware of the risks of trading in the capital markets. You are strongly advised not to trade with capital you cannot afford to lose. This article is neither a solicitation nor an offer to buy or sell securities.