NASDAQ Commentary
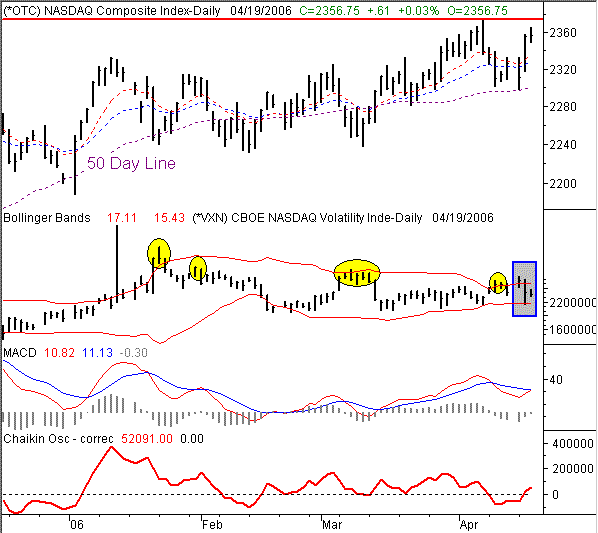
Following Monday's selloff and yesterday's rally, there's surprisingly little to talk about today. The current reading of 2356.75 is about even for the day, while the NASDAQ is up 30.64 points (+1.32%) for the week so far. So how is a 30 point gain nothing to talk about? Normally that kind of momentum is bullish, right?
Normally, yes. But for the NASDAQ, things really aren't normal. The fact of the matter is that the NASDAQ Composite is right where it was two Thursday's ago. Point being, there's really no net progress being made. We're just stringing together a fairly even set of bullish and bearish days.
To confuse matters even more, the CBOE NASDAQ Volatility Index (VXN) has been well-traveled over the last three days. You may recall that the VXN's recent encounter with its upper Bollinger band was a generally bullish sign. And sure enough, the NASDAQ popped up by more than 40 points since then (most of which came yesterday). However, as a result of that rally, the VXN fell all the way down to its lower Bollinger band. That actually has bearish implications. So far today, the VXN is right in the middle of its band lines, and hasn't even come close to testing either one. So, the VXN is basically useless as an indicator at this point.
Back to the NASDAQ......
The composite is also trapped in its own box. We see support around the 50 day line (2300), but we also see resistance at its recent high of 2375. So, in the meantime, we're waiting for a little more clarity form our charts. Things appear bullish after yesterday's burst, but we've seen little to no follow through all year long. Only a close above 2375 would allow us to be completely bullish.
That said, we actually have short-term bullish bias based strictly on a couple of technical signals. We have a Chaikin line crossover, as well as a MACD crossover. Plus, it's not as if the market has had an impossible time hurdling prior highs. We'll also point out, though, that the move past new highs (once reached) has been minimal for all the indices. So, if 2375 is passed, don't look for a major upside gain afterwards. The lethargic spring-time trading will further diminish movement.
NASDAQ Chart

S&P 500 Commentary
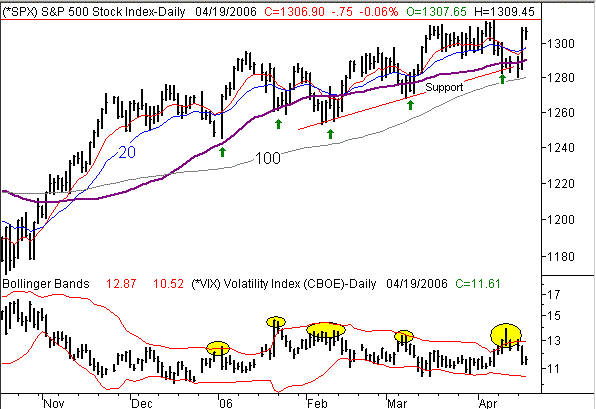
The S&P 500 is basically flat for the day, but up by 17.8 points (+1.38%) for the week. However, the current reading of 1306.90 is also about the same reading we saw in mid-March. In other words, while the NASDAQ has had a tepid two weeks, the S&P has been grinding for over a month. So, don't get too excited over Tuesday's huge day....it just cancelled out last week's selloff.
We've been following the CBOE Volatility Index (VIX) with some interest lately, primarily because its ultra-low trading levels indicate that investor confidence is dangerously high (that's typically when corrections start). To some degree, we saw the VIX and the SPX behave as expected over the last few days; the VIX rose from 11.45 to 13.90 as the S&P 500 fell from 1309 to 1286. Then once the VIX topped at the upper Bollinger band on the 12th (highlighted), it started to fall as the SPX rallied.
Now, however, the VIX is back in the middle of its band lines, and pretty much untelling.
Likewise, the SPX has already stalled between key support and resistance levels, unable to follow through on Tuesday's monster gains. That resistance is at 1315, while the support is at 1280, where the 100 day line (gray) halted last week's selling and pushed the S&P 500 higher again. This is our first look at the 100 day line in a long time, but we intend to leave it on our chart for a while - as long as it's a factor.
In the meantime, we really have no short-term outlook. The SPX has been neutral (net) for a month, stuck in this horizontal range between 1280 and 1315. We're reserving any outlook until we actually break free from that zone.
S&P 500 Chart

Dow Jones Industrial Average Commentary
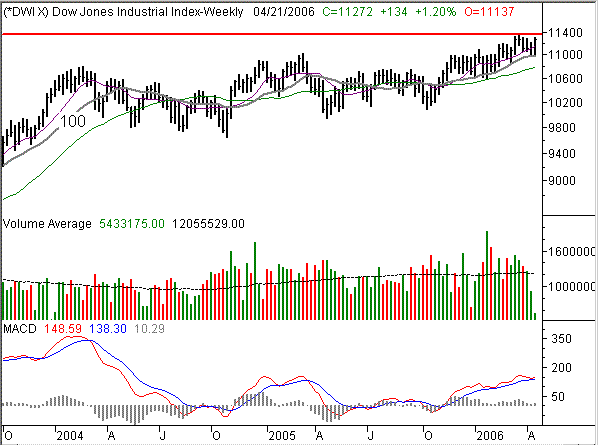
The Dow is trailing the other two indices for the week, with only a 1.2% gain so far. The current reading is at 11272. But, as you may have guessed by now, that's about where the Dow closed in mid-March. So like the overall market, the Dow seems to be range-bound in the short-term.
Just for the sake of variety, we're going to look at a weekly chart of the Dow. Here the short-term resistance becomes very apparent. The current ceiling is at 11,364, where we topped out in late March. The floor is just a hair above 11,000, where we made lows last week as well as this week. We're neutral until one of those lines is broken.
In the bigger picture, we can still see an uptrend for the Dow. Volume has been good, and given enough time, the Dow has managed to breach prior highs without any major setbacks.
Like the SPX, we've seen the 100 day moving average become an important support line for the DJI chart. That's the gray line on our chart, which we'll leave plotted as long as it's useful. The 100 day average has been support since February, and was redefined as support over the last few days. It's currently at 10,977, but will be at 11,000 within a few days. At that point, the coupling of a key moving average line with a big round number (a mental market milestone) will set up a major support level. If the Dow falls under that line, then look out below. But more than anything, we expect 11,000 to halt any declines, and ultimately serve as the rally point for any bullish legs.
Dow Jones Industrial Average Chart

Price Headley is the founder and chief analyst of BigTrends.com.