NASDAQ Commentary
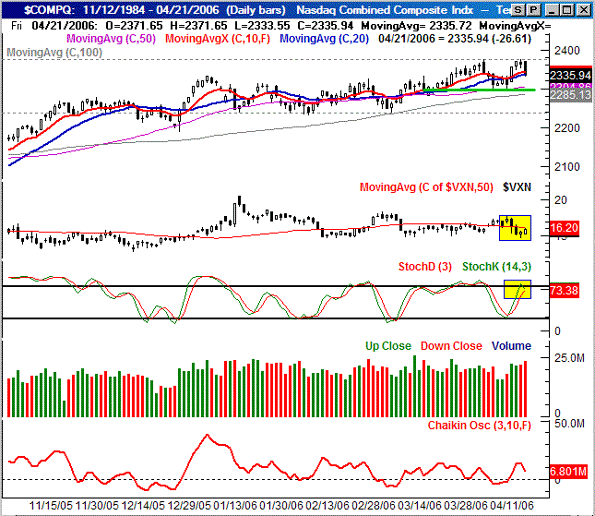
It was a wild ride, but the NASDAQ ended the week with a respectable gain of 0.72%. The close at 2342.86 was a 16.75 point improvement from the end of the prior week, although it's wasn't necessarily a bullish sign of things to come. The NASDAQ basically matched its previous 52-week high of 2375 (from early April) and was sent tumbling again. At the same time, support lines are squeezing the index from the bottom up. Something's got to give soon.
Based on all we see right now, it looks like the NASDAQ is headed lower at least to some degree. That double-top at 2375 is pretty telling, but that's not the only reason we're looking for a dip. The VXN has put in a reversal pattern over the last three days, and if it follows through to the upside like we think it will, then stocks will have to fal proportionally. Keep in mind, however, that expiration week was last week, which taints the VXN readings a litte bit. The stochastic lines are approaching 'overbought' levels, although timing the stochastic-based pulbacks has been tough to do lately. Any single one of those sins wouldn't alone be a bearish pattern. But to see them all simultaneously is a strong clue.
Of all the bearish hints, volume is the biggest. Friday was a distribution day, which we've seen more than a few of lately. The Chaikin line is pointed lower, although it has yet to cross under the zero line - the official sell signal.
That said, we've been down this road before. The composite has been - and still is - range bound. So even the signals we do see are questionable. Until the NASDAQ can actually break out of this range, we don't see many bearish of bullish opportunities. The resistance is at 2375, but we're going to plot support at 2300. That's the spot where the index hit lows a few days ago, and it's also the mid-point beween the 50 day and 100 day moving average lines. Be patient here.
NASDAQ Chart

S&P 500 Commentary
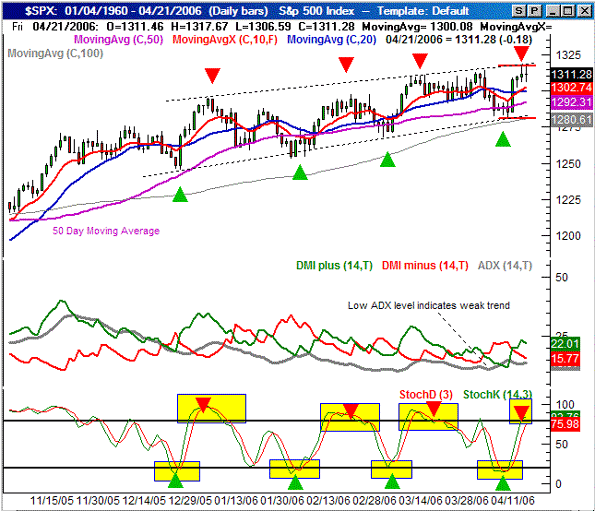
While the NASDAQ made decent gains, the S&P 500 left the NASDAQ in the dust (a bearish concern in itself). The SPX gained 1.72% (+22.2 points) to end Friday's session at 1311.20. Along the way, a new multi-year high was hit this one at 1318.15. However, those moves into 'new high' territory have had little to no follow thorugh over the last four months. So, despite the big gain for the week and the relative strength on Friday, we're still a little suspicious of the S&P 500's apparent bullishness.
The pressure of being stochasticaly overbought is really starting to weigh in on the SPX. The last three times we were here are marked on the chart - all three resulted in weakness. In fact, the stochastiic lines and the trading channel the SPX has been stuck in has been the only reliable trading patterns to speak of. And as of right now, the pattern is telling us that we're at a short-term top, and we should expect a pullback.
The entries into stochastic 'overbought' levels are marked with red arrows, while the 'oversold' periods are marked with green arrows. You can also see that, simultaneously, the S&P 500 has pretty much defined straight-line support and resistance (dashed lines), forming the generally bullish channel we see going back to January. Until we have a clear reason not to think so, we have to expect this pattern to keep repeating itself. We hit the resistance at 1318; now we're looking for the move back to the lower edge of the channel, currently at 1282. That's only about a 30 point dip though.
What about the bigger picture? We know that periods of low volatility are followed by periods of high volatility. So, eventually, the S&P 500 will have to break out of this rut and start moving again (bullishly or bearishly). However, a cople of things will need to happen first. The first is (obviously) a break ouside of the range. The second is that the ADX line will have to start rising again. It's been stuck under 20 for weeks now, verifying that the chart truly is trendless (which is why stochastics has been so effective). So, we are indeed ripe for a big move of some sort. The probem is, the month of May kicks off the most lethargic period of the year. So, we may not get a reprieve anytime soon. Just keep that in mind as we progress through Q2. If the environement starts to change, we'll look at that here.
And by the way, we expect to see a neutral-to-bearsh environment in Q2, so odds are that the support line will break before the resistance lines do. The 100 day moving average (which we rarely look at) is going to be the line in the sand. It's currently at 1280 - just a hair under that support line. A close under that mark should signal the transition into a mldly bearish mode.
S&P 500 Chart

Dow Jones Industrial Average Commentary
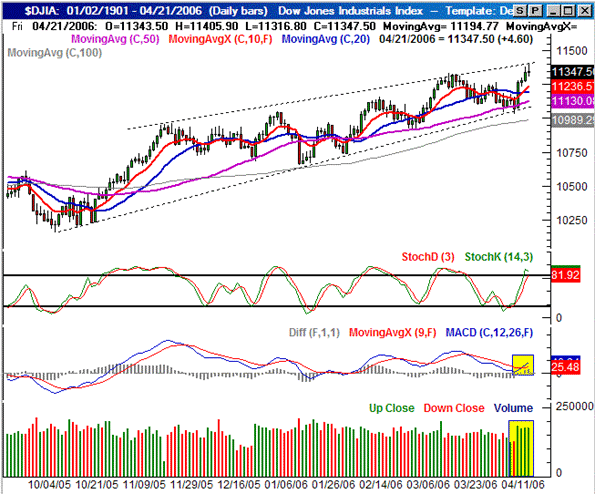
Lo and behold, the Dow took top honors this week, gaining 209 points to close out at 11,347. That's a 1.88% gain, which barely edges out the S&P 500's return. Like the S&P 500, a new 52-week high of 11,406 was reached. However, that was also where we plotted a major resistance line going back to highs hit several years ago. That's also where the intermediate-term resistance line is currently resting, so we see the Dow as - literally - right at its realistic ceiling. And as such, we're looking for this blue-chip index to sink in the near-term.
The likely landing point is somewhere around 11,000. That's where straight-line support is right now, squared between the 50 day and 100 day moving average lines.
Despite the fact that the Dow is setting up a pullback, notice the bullish MACD crossover, and the solid bullish volume last week. On a relative basis, the Dow may survive any pullback better than any other index. However, it's stil going to give ground if a correction occurs. In fact, that relative strenght indicates that a pullback is likely. Traders are moving pout of the more speculative and small cap names, and into the safer blue chips. That's usually an omen.
In terms of the biiger picture, despite the 'Sell in May and go away' rule, we're not going to adopt any major bearish stances unless the 100 day line at 10,990 is breached. The mini-correction we're looking for next is only toward the lower 11,000 area.
Dow Jones Industrial Average Chart

Price Headley is the founder and chief analyst of BigTrends.com.