- Market: June 2006 30 yr US T-Bond (USM6)
- Tick value: 1/64th = $15.625
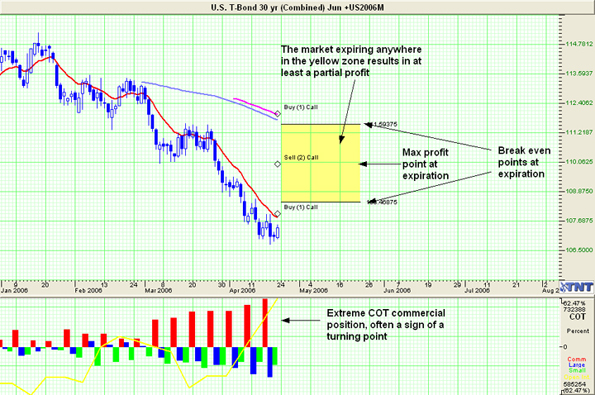
- Option Expiration: 05/26/06
- Trade Description: Bull Butterfly Spread
- Max Risk: $468.75
- Max Profit: $1531.25
- Risk Reward ratio 3:1
Buy one June 2006 30 yr US T-Bond 108 call, also buy one June 2006 30 yr US T-Bond 112 call, while selling two June 30 yr US T-Bond 110 calls, for a combined cost and risk of 30/64ths ($468.75) or less to open a position.
Technical / Fundamental Explanation
Bonds have had quite a sell off for all of 2006. This trend seems to have lost steam and we are now facing at least a short term reversal. Of the 14 indicators that I use, 9 of them have issued buy signals within the past 5 days. This is about as may indicators lining up in the same directions as I have seen in a long time so I cannot ignore these signals any longer, even if I have been and continue to be a bond bear. Short traders should tighten stops or cover if you haven't already. Current COT data shows Commercial traders at a extreme point not seen since the last time bonds bottomed. Add it all up and you get a buy signal. I chose a butterfly because it gives us a wide target at expiration of over 3 full basis points while at the same time keeping risk below $500.
Profit Goal
Max profit assuming a 30/64ths fill is 98/64ths ($1531.25) giving this trade a little better than a 3:1 risk reward ratio. Max profit occurs at expiration with 30 yr US T-Bond trading at 110. Break even points at expiration are 108-15 and 111-17, meaning at expiration we have a range of over 3 full basis points in which we can profit in.
Risk Analysis
Max risk assuming a 30/64ths fill is ($468.75). This occurs at expiration with the 30 yr US T-Bond trading below 108 or above 112.
Matt Odom is the Managing Partner and Energy Analyst and Derek Frey is Head Trader at Odom & Frey Futures & Options.
Disclaimer
Past performance is not indicative of future results. Trading futures and options is not suitable for everyone. There is a substantial risk of loss in trading futures and options.


 Free Festival of Traders Videos