We've been looking at some charts in recent columns, and now that what we were looking for (or at) has changed, I didn't want to leave anybody hanging. We'll be bringing some closure to two of them, and the third one....well, you'll see.
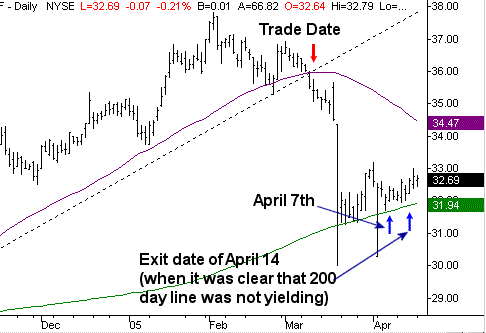
Back on April 7, we took our first look at First American (FAF) shares. We shorted this stock on March 10 after a severe fall under a key support line as well as the 50 day moving average line. What was so remarkable was how that subtle failure of support led to good-sized gains for us just a few days later. As of April 7, you may recall that we were seeing support at the 200 day line. And that would be the determining factor in whether or not we stayed in the trade, or would be looking for the next leg down. As of April 14 (last Thursday), it was clear that the 200 day line was indeed going to hold up as support. We made an exit that day. The implication for you readers is simple - pay attention to the simple things. The 200 day line was - and is - support, and using the 200 day average makes that obvious.

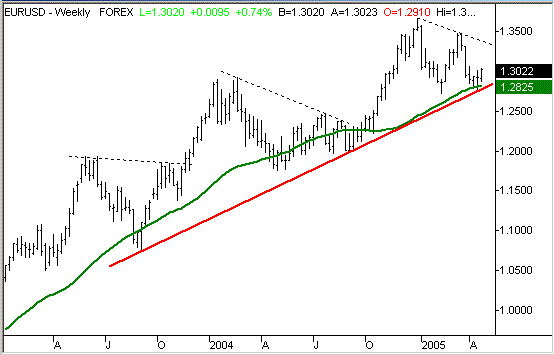
On April 5, we reviewed how the U.S. dollar might finally be turning things around and getting stronger again. The euro/dollar conversion rate had shown us strong support line since 2002, but that support line was being pressured. The 200 day line (green) was also being pressured, so it appeared that the dollar had a legitimate shot at finally improving. Since then, however, not only has the support line not been breached, but the euro looks like it's strengthening again (meaning the dollar is still on the slide). As of Monday, the euro/dollar was at 1.30....well above the support around 1.27. This one is still up in the air, but the chart momentum is clearly favoring a stronger euro and a weaker dollar. (A similar chart applies to the yen/dollar exchange rate).

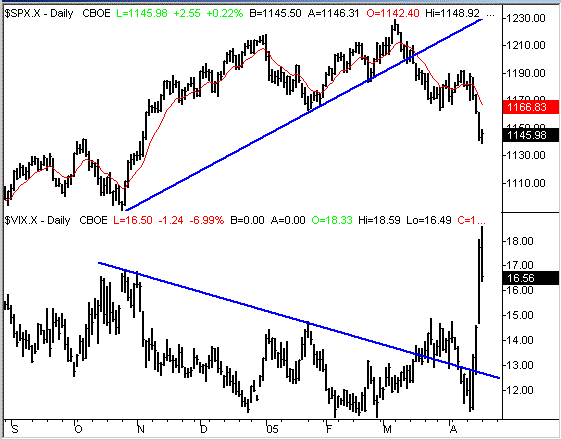
On March 17, we took our first close look at the CBOE Volatility Index (VIX). For months it had been inching lower, held down by a pretty strong resistance line. Knowing that extremes in the market are eventually reversed, we felt it was only a matter of time before the VIX snapped and made a huge move higher.....dragging stocks down at the same time. As of the 17th, it was only a possibility, with the VIX only trading right at the critical line. Since then, the VIX has broken past that resistance line - twice! The first time was in late March, and sure enough, stocks made a mild decline. By the time April rolled around, stocks were leveling off and the VIX was actually back under the resistance line. That is, until last week. The VIX exploded last week, hitting levels we hadn't seen since last August. Needless to say, the previous resistance line has been obliterated, so the market's easy ride is over. This spells a little trouble in our future.

From here we're still trying to figure out what the new pattern for the VIX is. It's unlikely that the VIX cand keep moving up at this pace (it actually pulled back a bit yesterday), so we're expecting the index to fall at least a little bit before stabilizing. That fall will probably mean a little bullishness for stocks - but not a whole lot. Just enough to allow investors ot digest, and respond. With the indexes breaking under key support and the VIX breaking above a key resistance line, new trend lines are probably being set in place. They just aren't visible yet. Once last week is all sorted out, odds are that the VIX will still be pointed higher.
Price Headley is the founder and chief analyst of BigTrends.com.