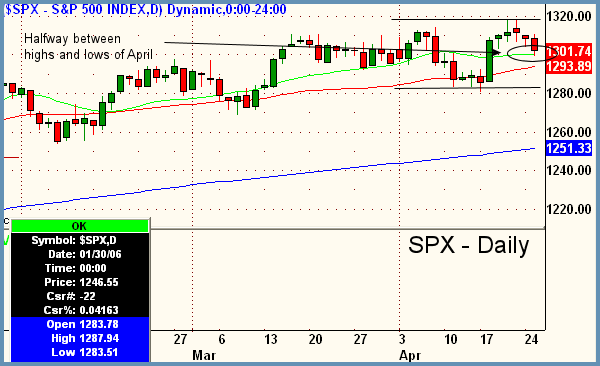
Good Morning, Traders. The markets moved lower across the board yesterday as a huge slew of earnings reports which were mostly positive failed to move the markets. After opening up slightly higher, the markets stayed in a holding pattern until 10:00am EST awaiting the Consumer Confidence and Housing Starts figures. Interestingly enough, both of these beat consensus estimates and came in ahead of prior period readings but the market construed the news as negative and sold off regardless. Remember that its always the markets reaction to economic news and not the news itself that is of note. By the time the bell rang, the Dow had managed to erase 53.07, the S&P shed 6.37, and the Nasdaq lost 3.08. Selling was pretty much across the board and broad-based with almost all sectors in the red, most notably, the $DJUSHB (Dow Jones U.S. Homebuilders Index) losing almost 2% from the open and the $GIN (Goldman Sachs Internet Index) off by the same. Oils, oil services and biotechs were also weak. Some very small pockets of strength were found in mining stocks ($GOX) and also in semiconductors ($SOX) which held up pretty well despite the overall market's weakness.
In yesterday's commentary, we showed how the Nasdaq was right in the middle of the range of the month of April. To further drive the point home that we are rangebound here, today's chart is the daily S&P 500 which after yesterday's selloff is also right in this middle zone. Always remember that whenever a stock or index is directly in between the highs and lows of a trendless range (April), there is exactly a 50% chance that you will move to the upper end and the same 50% chance that you will move to the bottom end. For this trader, thats just not good enough odds. Be careful out there. Near-term bias remains sideways to down.

Peter Reznicek is the Chief Equity Strategist and a principal of the Prana Fund, a domestic hedge fund, and ShadowTrader, a subsidiary of thinkorswim which provides coaching and education to its clients on both intraday and swing trading of equities. For a free trial to the full version of The Big Picture or to learn about ShadowTrader's other services, visit shadowtrader.net or send an email to preznicek@shadowtrader.net.