NASDAQ Commentary
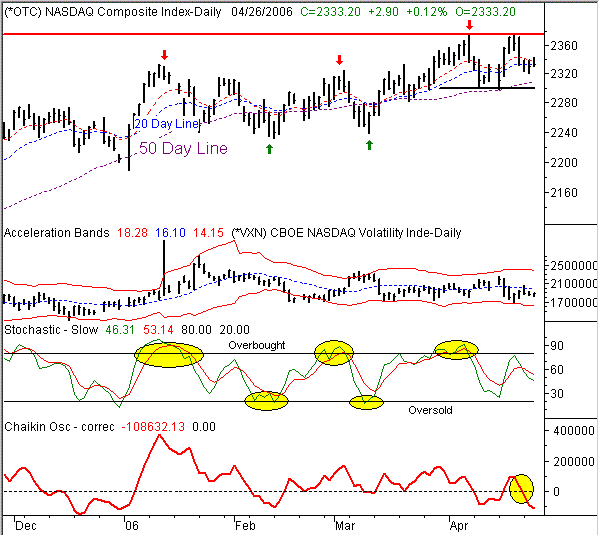
Don't get fooled by the NASDAQ's slight gain today. We're still at breakeven levels for the week, and the month, and three months for that matter. The current reading of 2333.20 basically matches the close at 2331.33 from January 11th. Since then, never has the index traded above 2375, and never under 2232. That 143 point span is only about 6 percent of the composite's current value, which is a pretty narrow range for a three-month period......by anybody's standards.
As such, there's just not a lot to look at in the MidWeek Update. The edges of that range are still support and resistance levels, and the NASDAQ is still dancing all around its 10 day (red) and 20 day (blue) moving average lines. It's a very choppy - and almost unusual - environment for traders to deal with. Even the VXN has been mostly inconclusive.
The best tool throughout all of this has been our stochastics chart, as it has spotted most of the short-term tops and bottoms. As it stands right now, it's leaning towards bearishness, so we are too. The actual sell signal was triggered in early April (the 7th), yet the NASDAQ managed to climb back up to the same high where the sell signal was first made (2375). Seeing that double top, though, only makes the scenario that much more bearish, in that traders drew a firm line in the sand at that point.
As for where it might stop, we'll only go as far as 2300 right now. Not only is that a big psychological support area, it's also where the NASDAQ bounced twice earlier in the month. If that support line fails, then 2240 would be the next potential landing spot.
NASDAQ Chart 
S&P 500 Commentary
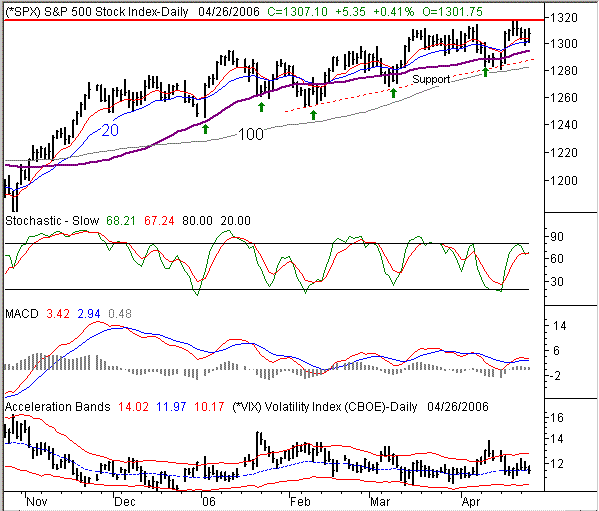
The S&P 500 is actually outperforming the NASDAQ today, but it doesn't mean a whole lot. For the week, the SPX is down by 4.2 points (-0.32%), and is still unable to keep hitting new highs with any continuity. That said, the S&P 500 still hot those new highs when it reached 1318.15 last Thursday. The current reading of 1307.10 is well under that mark, but falling back after hitting new highs has pretty much become the norm here. The SPX is still above the 10 and 20 day averages, so technically speaking, the trend remains bullish.
That said, like the NASDAQ, we still expect to see this large-cap index fall back from that recent by a little more that the current 11 point dip. There's an intermediate-term support line currently at 1287 (dashed) that seems to be a much more likely target. That line is sandwiched under the 50 day line, and above the 100 day average. Normally we might look to the 50 day line as a bounce point, but it hasn't been since February. So, we'll lower the bar for the time being, so to speak.
The ultimate bull/bear line, though, is the 100 day moving average at 1282. Only a break under that mark would move us to a bigger-picture bearish stance. However, given the time of year that we're in (when things slow down), that's a distinct possibility. Despite the fact that we just went through the most positive first quarters we've seen in years, traders are getting a little frustrated with a very ineffective market. That's a potential catalyst for a lethargic bearish environment over the next few weeks; the 100 day line is the key signal line for that possibility.
S&P 500 Chart 
Dow Jones Industrial Average Commentary
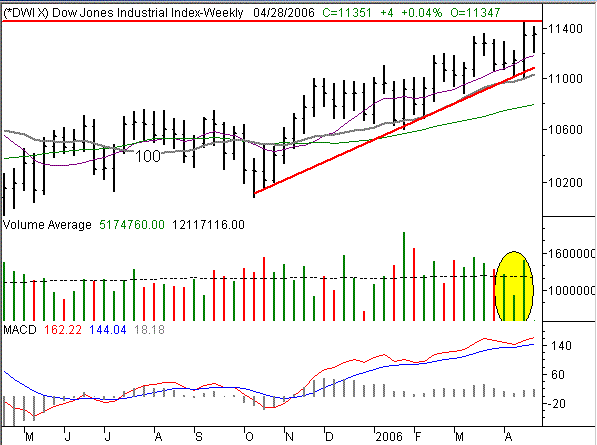
The Dow's 68 point gain for the day (so far) still leaves it right at break-even levels for the week. And more than that, the blue-chip index is still under resistance at the recent high of 11468, yet above support at 11,179, where the 50 day line is resting. In other words, we're stuck in neutral here too.
Just for the sake of variety, we'll look at the Dow's weekly chart. Clearly it's bullish, supported by a trend lien that goes all the way back to October. Interestingly, the Dow showed us a high degree of bullish volume last week. In terms of the bigger picture, the volume and the relative strength is consistent with the idea that investors are rotating out of the speculative and smaller companies, and into these more established stocks. However, we'll also caution you that if a bearish turn gets bad enough, the Dow won't be immune to it. It would still be the better place to be in terms of smallest losses, but there would still be losses.
If instead the coming weeks are only neutral or even mildly bearish, the Dow may well be the best place to look for buy-and-holders.
What's the make-or-break point? Use the 100 day line at 11,000. If the Dow falls under that line, that could be a moderate problem for the bulls.
And on that note, we'll just say to the traders, the coming weeks are typically choppy and involatile. Reversal-based tools and scalping tend to do better in that environment. It's not likely that the market (or any index) will make a major move in any direction. We do, however, expect some sectors decisively lead or lag. Just be sure that your strategy, style, and timeframe make sense for the environment we're going to be in.
Dow Jones Industrial Average Chart 
Price Headley is the founder and chief analyst of BigTrends.com.