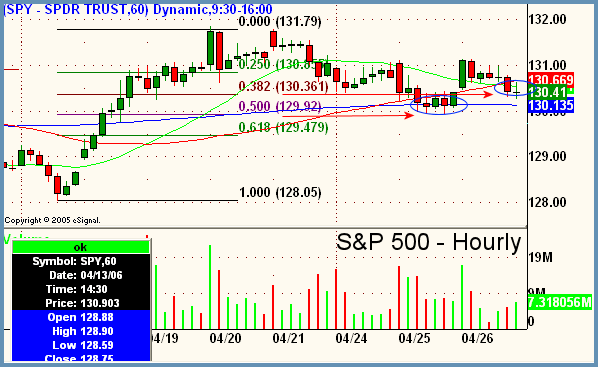
Good Morning, Traders. All three major averages that we watch closed green but for those of us in the trenches, it certainly didn't feel like it. After a slight gap up and a strong run in the first hour, the market spent the rest of the day in an extremely choppy and tight range whereupon it zig zagged sideways to down for five straight hours. Although the Dow tacked on over 70 points, the breadth was close to even at the close and advance decline lines closed nearly flat as well. In recent commentary in this space, we have been focusing on the very ambiguous state of affairs in the broad markets. Yesterday's tight range only added to the confusion. The chart below is an hourly SPY (S&P Depository Receipts or SPDR's which track the S&P) which shows trading action of the last 8 days or so. Over at the left side of the chart we can see the rally which started on April 17th. We have annotated the chart with a Fibonacci retracement overlaid on the price action to try and discern whether the recent rally is intact and we can expect further upside in the near term or not. The two circled areas in the chart represent the 38.2% retracement from the high and the 50% retracement, respectively. If the market was to pivot and continue upwards (near-term), then either of these two areas would be the place to do it. The problem is that the market just can't seem to make a definitive bounce at either of these two areas. Upon hitting into the 50% retracement area on April 25th, we rallied a bit only to fall back down to the current area at the 38.2. While all of this is happening the confluence of moving averages in the current area on this hourly is just confusing. Note that all three of the major ma's that we watch (20, 50, 200) are all bunched up in this area. Moving averages on hourlies are excellent for measuring short term trends in the market. Note how all three (green, red, blue) are all moving sideways and bunched together, telling us that the market is simply sideways at this juncture. Use this time to scan the markets for longer term plays setting up on weeklies or consider taking more hit and run type of trades with shorter (1-3 day) timeframes to capitalize until the market shows a more defined trend.

Peter Reznicek is the Chief Equity Strategist and a principal of the Prana Fund, a domestic hedge fund, and ShadowTrader, a subsidiary of thinkorswim which provides coaching and education to its clients on both intraday and swing trading of equities. For a free trial to the full version of The Big Picture or to learn about ShadowTrader's other services, visit shadowtrader.net or send an email to preznicek@shadowtrader.net.