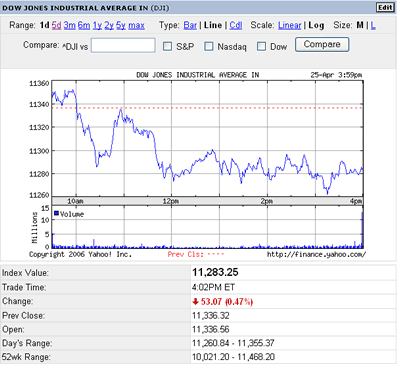
Markets took a large hit yesterday, even after positive consumer confidence, existing home sales, and earnings data. The Dow, S&P, and NASDAQ all closed lower on the session.
Today, the 10-year Treasury yield is back on the radar, currently at 5.10% after sleeping at around 5% the past few days. This morning's Durable Goods report came out better than expected, as orders increased by 6.2%. This proves the economy is strong and has bond traders concerned this may mean continued tightening of interest rates, despite the comments in the recent release of the FOMC minutes. The minutes suggested that there would be no more tightening required after the increase to 5% at the May FOMC meeting.
At 10:30 this morning, the EIA Petroleum Status Report is to be released. This report on current US oil inventory numbers is also important to today's market action. Crude oil prices will act accordingly to the data and reflect either positively or negatively on the stock market depending on crude oil's reaction.

Positive earning continue to be released and stock futures are up this morning, but today may be another tough day for the market depending on oil inventory numbers and interest rates.
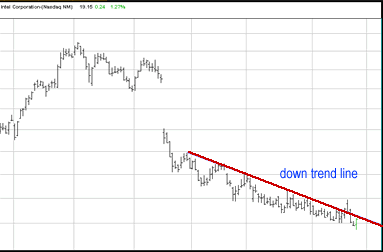
Intel Corporation (NASDAQ: INTC) has not been performing so well the past 5 months or so. Following a sizable downside gap, the stock entered into a downtrend. This down trend has gone on for quite some time. Yesterday, INTC made a positive move back to the downtrend line. This upside move occurred in a down market, although it should be noted that the Semiconductor sector outperformed yesterday. Does INTC have what it takes to break out of this downtrend, or will the trend continue?

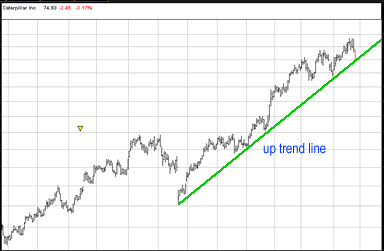
Caterpillar Inc (Ticker: CAT) is a pretty simple play here. We have a strong company with solid fundamentals, solid management, and a products that are consumed by a "monster market" pulling back to the uptrend line. In my mind this is a no brainer. CAT released a positive earnings report with positive comments on future numbers and this pullback simply represents profit-takers ringing the register.

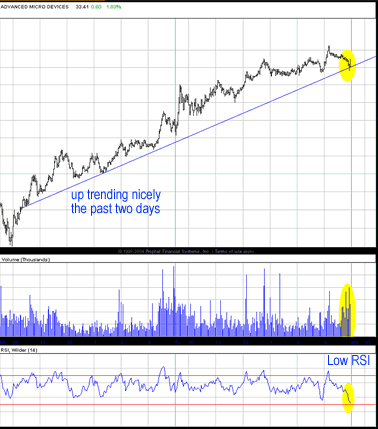
Advanced Micro Devices (Ticker: AMD) has been impressive the past two days in a weak market. An uptrend this consistent during a weak market is not something you come across every day in relation to day trading stocks. The questions is, will AMD continue to rise? There are a few indictors here that tell me it has a good chance.

The chart above is a 2-day, 2-minute chart for AMD. First, notice the solid 45 degree uptrend line that I have drawn on the chart. Next, notice the 3 yellow highlights on the chart. The yellow oval at the top of the chart represents the pullback to the trend line at the end of the day. The highlight below shows that this downside action occured on high volume. High volume selling interest does concern me in this case, but the fact that the RSI levels are approaching 30 (highlighted at the bottom of the chart) give some relief to my concerns. When RSI reaches these levels, it signals that the stock is oversold.
Andy Swan is co-founder and head trader for DaytradeTeam.com. To get all of Andy's day trading, swing trading, and options trading alerts in real time, subscribe to a one-week, all-inclusive trial membership to DaytradeTeam by clicking here.