NASDAQ Commentary
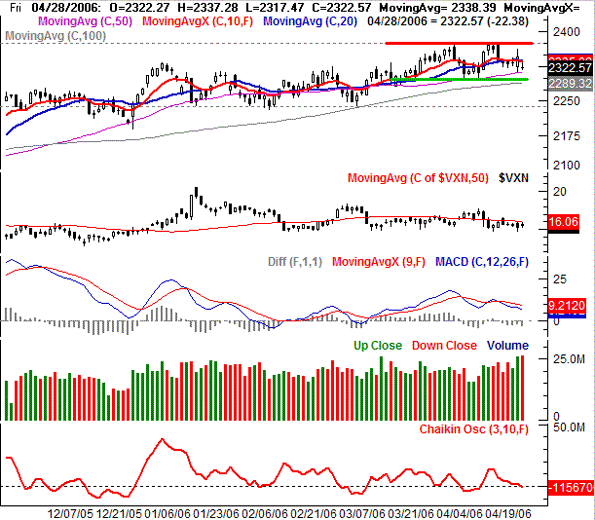
The composite's close at 2322.57 was 20.29 points lower than the previous week, locking in a dip of 0.87%. That was the worst showing of all the indices (and basically the only losing one). The NASDAQ didn't even make an attempt to get back above the resistance at 2375, where it's topped out twice over the last month. Instead, Friday's selling left the index under the 10 and 20 day lines. However, the close above the support of the 50 day line just means it's business as usual....the NASDAQ is right about where it was as of January 10th, clearly still stuck in a tight range.
As of right now (within the confines of that range) the trend is technically bearish. We're in the wake of a MACD crossunder, and we hit resistance at the 10 day moving average.
We also mentioned last week that the falling Chaikin line was at least a bearish omen. It wasn't a 'signal' at the time, as it hadn't yet crossed under zero. Over the last week though, it finally has. But truthfully, you don't even need the Chaikin line to see that the selling volume has been getting bigger - just take a look at all the growing red bars on our volume chart.
However, there's a stark reality that taints that bearish bias. That is, we've seen this over and over this year. The NASDAQ has just been bouncing around in a range for months (2233 to 2375), and more recently, in the even more narrow 2300 to 2375 range. Based on history, we're not getting overly bearish here. We'd need to see a couple of closes under the 100 day moving average at 2289 to really be convinced that the most recent bearish signals have any bigger-picture meaning. If instead we find support around 2290, then the range-dance is likely to persist.
NASDAQ Chart

S&P 500 Commentary
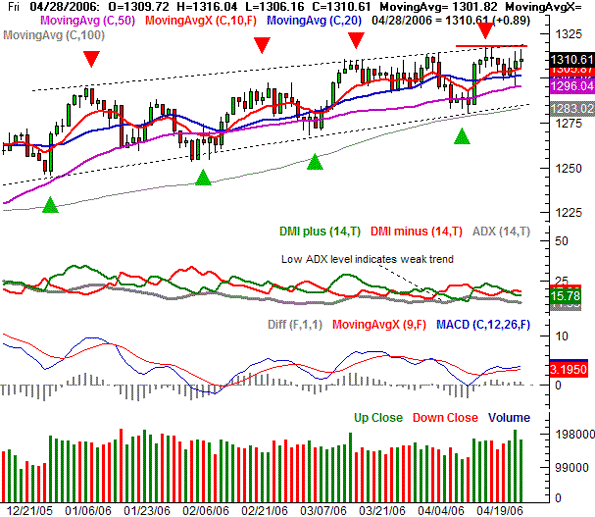
The S&P 500's 0.7 point loss was nearly negligible in terms of percentages (-0.05%). However, there were some other chart patterns that were slightly more telling. For starters, that close was well above the low of 1295.55, yet pressuring the high of 1316.05. That's a decent sign of buying strength. However, a real sign of buying strength would have been a close above last week's high of 1318.15; that line wasn't even tested this week. Opposing ideas? You bet. In fact, the bulls and the bears both have a lot of valid arguments about the S&P 500 chart right now. Let's look at some of them.
What's bullish.......
The S&P 500 is still above the 10 and 20 day moving averages. In fact, it found support at both of them this past week. Plus, the SPX is still inside a longer-term bullish channel (dashed)....and even pressing into the upper edge of that zone. Oh yeah, we actually got a MACD buy signal a few days ago. The bullish volume has also been increasing too. A big difference compared to the NASDAQ? Totally! But that's the reality of it.
What's bearish........
Despite the bullish list, being at the top edge of that channel is a recipe for a pullback. There's resistance around 1318, where we topped out two weeks ago, and where the key resistance line is placed. That has led to a 20 point selloff the last three times we've hit that line, and this could be a fourth. Plus, that persistently low ADX is still an indication that there really isn't much of any trend at all, even though there are a few bullish hints.
As such, we're looking for a retest of the support lines near 1290, and there are several all around there. The 50 day line is at 1296, and the 100 day average is at 1283. The support line is currently at 1285. Any of those three could potentially spark a move higher - once encountered.
As for a bigger move, we still need to see a break above 1320 or below 1290 to expect a long-term trend. Otherwise, the range-trading mode will still be in place. In the meantime, we're thinking the SPX is poised to fall from the upper end of the range to the lower.
S&P 500 Chart

Price Headley is the founder and chief analyst of BigTrends.com.