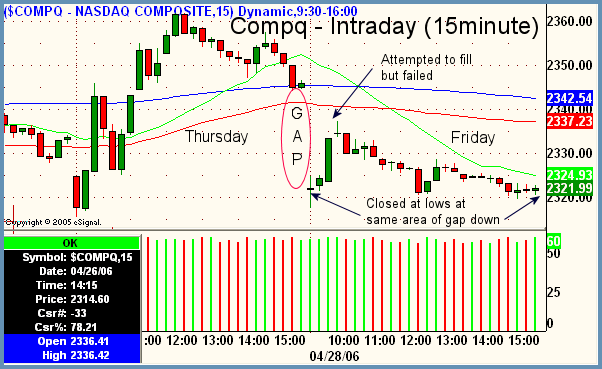
Good Morning, Traders. Disappointing MSFT earnings report on Thursday night caused a major gap down in the Nasdaq Composite ($COMPQ) and also Nasdaq 100 ($NDX), both indices that the tech behemoth can claim membership in. The chart above is an intraday two day picture of the Nasdaq Composite that illustrates the severity of the gap down and more importantly what happened to price action after the gap. Whenever an index or stock gaps down, the odds generally favor a counter move to fill the gap because simply put the market does not like gaps. Gaps create empty spaces on charts. Some technicians call these "air pockets" and some technicians call them "windows". Whatever the colorful terminology used, the most important information you can glean from a gap is what happened after it. Did it fill right away? Did it not fill at all? Did it fill only parially and then retrace? All of these are valid questions to ask to determine the technical severity and import of a gap. In the photo above we can clearly see that the gap between Friday morning and Thursday afternoon did not even fill. It attempted to fill but could not. More over, when it started to fade, it faded all the way back to the lows of the day where it opened. The Big Picture would say this is quite bearish and continues to support our position that tech is just not the place to be at this juncture. Overall bias remains cautiously bullish with the knowledge that the Nasdaq continues to show more and more relative weakness which could be an Achilles heel in this market that is increasingly tilted in favor of just a few standout sectors.
Focus List
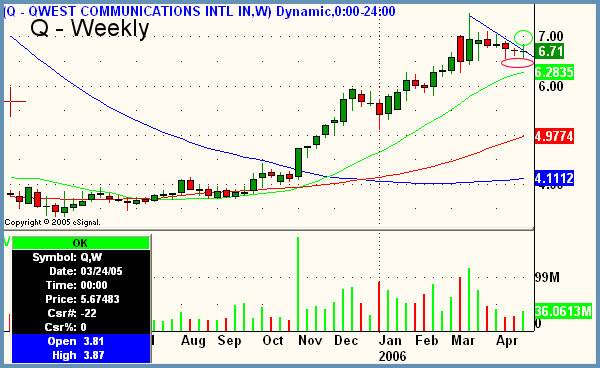
Q - Qwest Communications
Industry - Telecommunications
Side - Long
Trigger - 6.90
Stop - 6.49
Target - 8.00+
Timeframe - multiweek to multimonth
Notes
- $XTC (Telecomm Index) poised for some near-term gains currently
- Volatility contraction on weeklies as evidenced by two dojis in a row, which follwed a recent weekly hammer
- Entry is over top of trendline of pullback
- Volume patterns are confirming
- Monthly charts (not shown) show very little resistance above current levels
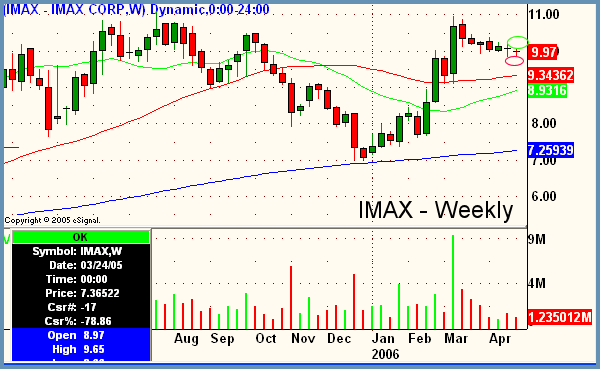
IMAX - Imax Corporation
Industry - Leisure
Side - Long
Trigger - 10.10
Stop - 9.80
Target - 12.45
Timeframe - multiweek
Notes
- Listed on Focus List of 4/19 but did not trigger
- Since our first mention the stock has consolidated further, creating another doji on weeklies which is inside the prior weeks range
- Relatively low risk entry here with entry and stop above and below highs/lows of last weeks small range bar
- Target is to next swing high on monthlies (not shown)
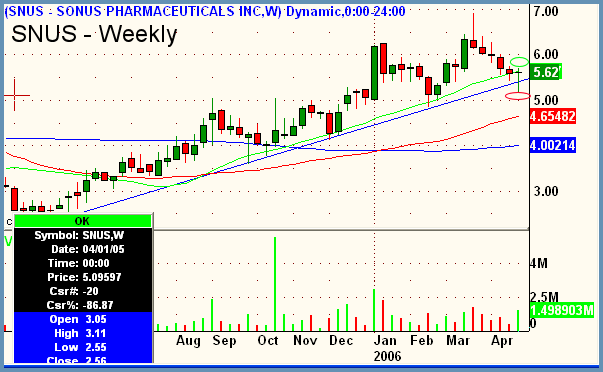
SNUS - Sonus Pharmaceuticals
Industry - Pharmaceutical (Diagnostics)
Side - Long
Trigger - 5.75
Stop - 5.13
Target - 6.92+
Timeframe - multiweek
Notes
- Relatively "clean" chart, straight stair stepping motion of rise then orderly pullbacks
- Target listed is to prior swing highs
- Weekly hammer at trendline and rising 20ma (green) support
- Target is to next swing high on monthlies (not shown)
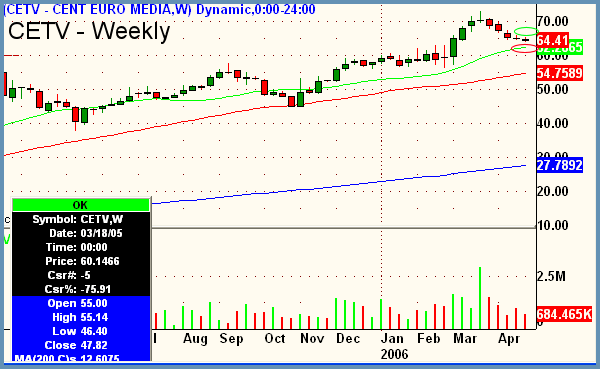
CETV - Central European Media
Industry - Media (Television Broadcasting)
Side - Long
Trigger - 65.38
Stop - 63.66 / 62.35
Target - 73.00+
Timeframe - multiweek
Notes
- Pullback resulting in contraction of volatility
- Small bodied weekly candles often precede groups of larger bodies
- Rising 20ma weekly (green)
- Stop can either be just underr last weeks doji or looser at under weekly 20ma
Peter Reznicek is the Chief Equity Strategist and a principal of the Prana Fund, a domestic hedge fund, and ShadowTrader, a subsidiary of thinkorswim which provides coaching and education to its clients on both intraday and swing trading of equities. For a free trial to the full version of The Big Picture or to learn about ShadowTrader's other services, visit shadowtrader.net or send an email to preznicek@shadowtrader.net.