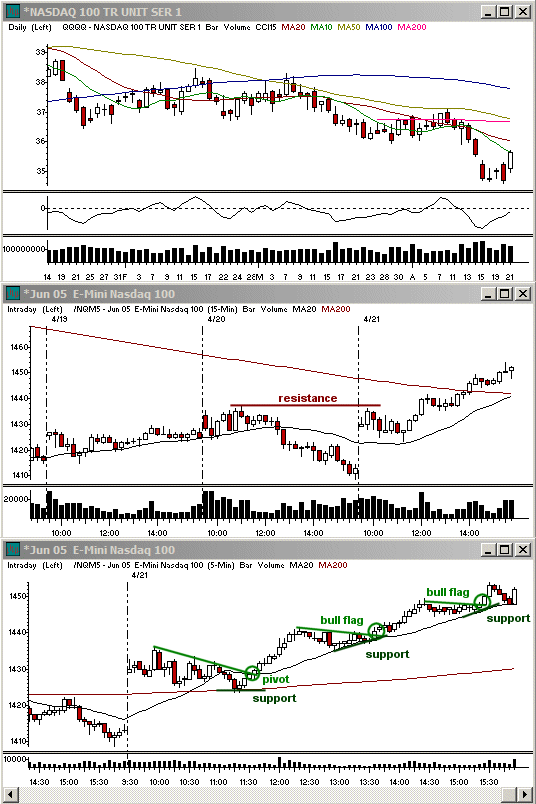
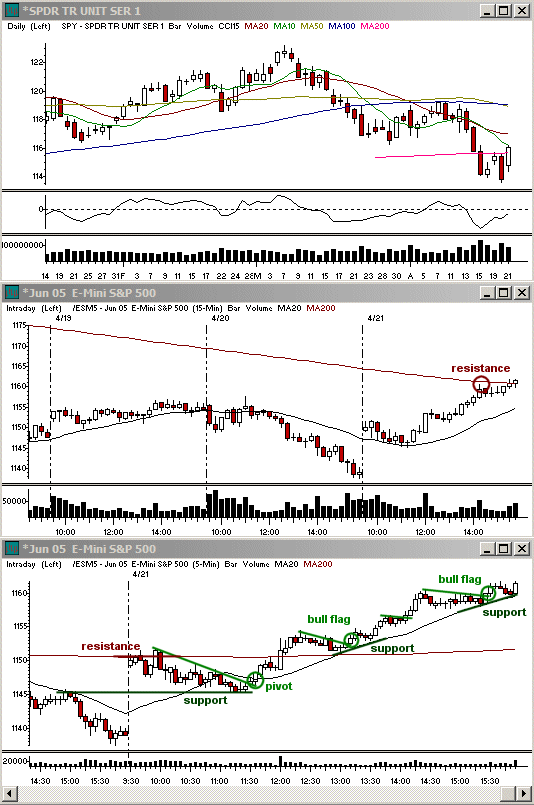
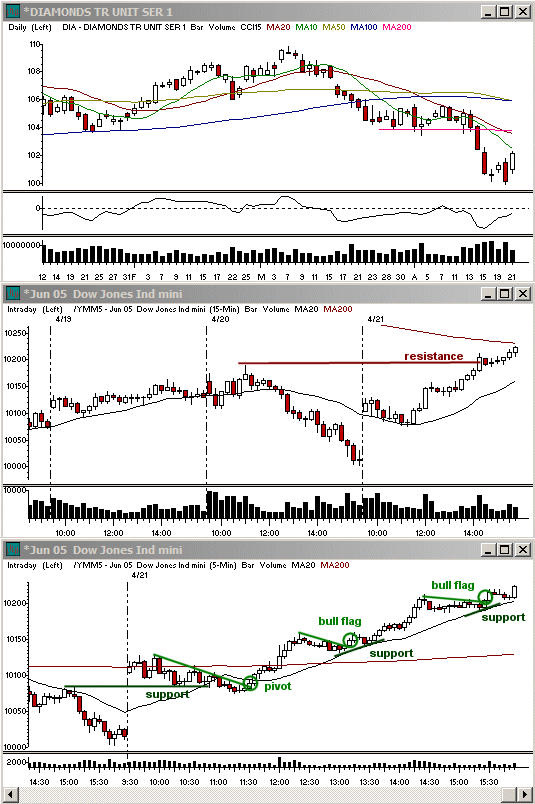
Good day! The market wasn't looking too great going into Wednesday's close, but the indices crept up throughout the premarket trading and opened significantly higher, gapping into the 30 minute 20 sma in the SP500 and the 5 minute 200 sma. The NASDAQ had overhead resistance as well at the prior day's highs. Even though a gap of this magnitude following so much selling will rarely close, the market still needed some time to correct to these price levels. This led to a gradual slide lower along the Dow's 15 minute 20 sma and similar action in the NASDAQ and SP500 heading into lunch.

While hopeful, the market wasn't looking too great going into lunch. Since the Dow couldn't shake it's 15 minute 20 sma support, the risk was higher that it would give way and that in the market as a whole the selling pace could pick up into the early afternoon. The indices managed to hold their mid-day support levels, however, and reacted rather swiftly to them. It didn't take long for the market to retest prior 5 minute highs and then continue into new highs on the day. This stronger upside pace following the more gradual descent set the mood for a trend day.

The first continuation took place in the early afternoon. The market hit the 5 minute 20 sma around 13:00 ET and by 13:30 we started to see some upside breakouts. The NASDAQ lagged behind the SP500 and Dow Jones Ind. Ave., but it triggered a nice triangle/bull flag breakout to lead the market into the prior day's highs in the Dow, the 15 minute 200 sma resistance in the SP500, and new highs on the week in the NASDAQ.

Without a great deal of overhead resistance after it based along highs again going into 15:30 ET, the market still had room for another wave of buying into the close. The 10 day sma was the next main resistance and served as a magnet for the market before the close.
The next pattern I will be watching for is a 60 minute cup with handle. This means a base of a day or two to let the 20 sma catch back up with prices on that time frame. Should that form, we are likely to hit the 20 day sma rather quickly. Look for a volume decline on the base to show that people aren't getting panicked. We do still have room for more rounded lows than we've gotten so far on the weekly charts, but so far the correction is doing rather well given how quickly the market dropped last week. Since it's Friday, that will help with a base formation and trading range as folks look to close out ahead of the weekend. I don't have anything new on the daily charts that catches my eye, so I'll just be looking intraday for setups.
Economic Reports and Events
Apr 22: -
Apr 25: Existing Home Sales for mar (10:00 am)
Apr 26: Consumer Confidence for Apr (10:00 am), New Home Sales for Mar (10:00 am)
Earnings Announcements of Interest
Only stocks with an average daily volume of 500K+ are listed. List may not be complete so be sure to always check your stocks' earnings dates before holding a position overnight. (A) = Earnings after the close, (B) = Earnings before the open, (?) = Earnings time not specified at the time of this writing
Apr 22: CX (B), EK (B), FO (B), HAL (B), IP (B), LSCC (?), LEA (B), HCR (B), MYG (B), MWV (B), RDC (B), ERICY (?), USFC (B), WFT (B)
Apr 25: ALTR (4:15 pm ET), ABNK (A), AMX (A), ACF (A), ACI (B), ASH (B), ATHR (?), AUDC (A), AVNX (A), BEAV (B), BYD (A), CD (A), CNET (A), CAM (B), XRAY (A), DST (A), ETR (B), EXC (A), GLK (A), HMY (05:30 am ET), HBAN (B), KMB (B), MSPD (A), PCL (A), PVN (?), SBC (B), SEPR (?), SLAB (A), SII (?), STK (A), SWFT (A), BNK (B), TRI (A), ZMH (A)
Apr 26: ABGX (A), ACE (A), AAI (B), AKS (B), AW (?), AXP (?), AGP (A), ABI (B), ASN (B), ATML (A), AUO (B), BJS (B), BOW (B), BP (02:00 am ET), EAT (B), BC (B), CHRW (?), COH (B), CVG (?), GLW (A), CFC (B), CK (B), ESV (B), EQR (B), ESRX (A), FNF (B), FPL (B), TV (A), HRS (A), HMA (?), INSP (A), LLL (B), LVLT (?), LXK (B), LMT (?), MSO (B), MHS (B), MNST (B), NVTL (A), OXY (?), PENN (B), PNR (B), PDG (?), PPP (?), RFMD (A), ROK (B), SLE (B), SLB (B), SNWL (?), SO (B), SNV (?), TMX (A), MHP (B), TSM (?), UST (?), VRTX (A), VFC (?), VIGN (B), WAT (B), WBSN (A), WWY (?), XL (A)
Toni Hansen is President and Co-founder of the Bastiat Group, Inc., and runs the popular Trading From Main Street. She can be reached at Toni@tradingfrommainstreet.com.