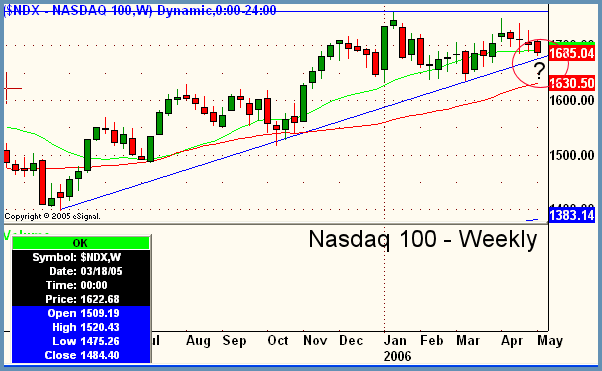
Good Morning, Traders. A "reinterpretation" of recent Bernanke comments put an already shaky market on Monday into a late day tailspin causing the Dow to close off 23.85, the S&P to shed 5.42, and the Nasdaq Composite to lose 17.78. Breadth closed negative as did advance decline lines. Although the late day knee-jerk selling was severe, no major trendlines or pivots in the three aforementioned major averages were violated. There was, however, one technical event which warrants some commentary and that is the trendline support area in the weekly Nasdaq 100 as shown below. In recent weeks in this column and in recent editions of the ShadowTrader Video Weekly, we have been discussing overall relative weakness in the Nasdaq Composite and Nasdaq 100 when compared to the S&P and Dow. Some traders and technicians feel that the 100 issues in the Nasdaq 100 should be "leaders" and tend to preface price action in the whole Nasdaq Composite. We tend to agree. If what are supposed to be the "biggest and baddest" of the Nasdaq start to breakdown, how much confidence will there be in all the other four-letter symbols? As you can see in the snapshot below, we have now sold off to trendline support in the $NDX. This is a serious make or break situation for this key index. If we have any confirmed close below approximately 1676, then the uptrend in the Nasdaq will be broken and could easily start to rollover to about the 1630 area which would be its next support at swing lows and also 50 period weekly moving average (red line). More importantly, if the $NDX does roll over here, the odds are strong that the Nasdaq Composite will follow and again it will just make it that much harder for the S&P and Dow to advance. Stay selective and nimble. Near-term bias is sideways to down, while overall bias remains upward.
Peter Reznicek is the Chief Equity Strategist and a principal of the Prana Fund, a domestic hedge fund, and ShadowTrader, a subsidiary of thinkorswim which provides coaching and education to its clients on both intraday and swing trading of equities. For a free trial to the full version of The Big Picture or to learn about ShadowTrader's other services, visit shadowtrader.net or send an email to preznicek@shadowtrader.net.


 Free Festival of Traders Videos