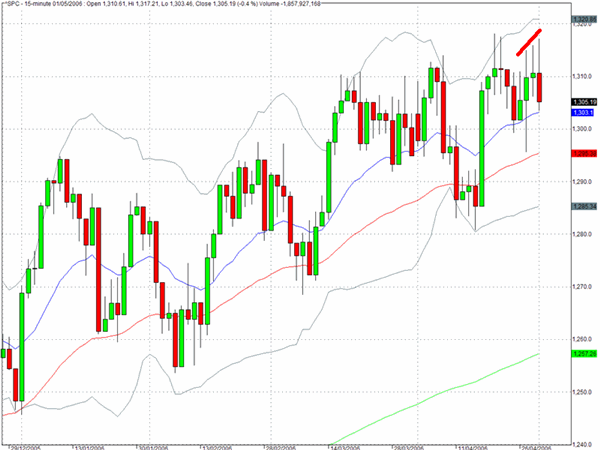
The markets experienced a rather nasty turnaround in yesterday's trading as questions surfaced as to how Bernanke's recent comments on future rate increases should really have been interpreted. After making a new five day high at 1317 the S&P 500 cash index dropped quickly in the latter part of the session to close at 1305 for a 0.4% decline on the day.
It is always difficult to guage how seriously one should take such swift changes in sentiment based on a news event and it may well turn out today that traders will cast aside their discomfort from yesterday afternoon in short order. But the reversal also underlines the point that there is a lot of nervousness, and perhaps increased vulnerability, in the market as the indices attempt to push higher.
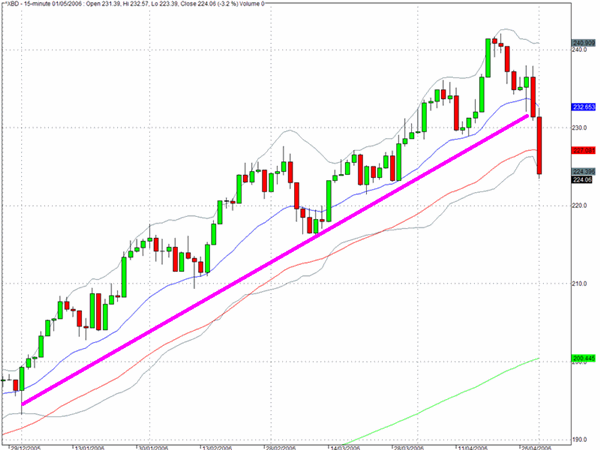
From time to time we have featured the broker/dealer index (^XBD) and remarked on the strongly bullish tone to the chart but over the last few sessions there is evidence that the long upward trajectory has finally run into resistance and that a period of correction is under way. Several of the individual charts BSC, GS, LEH and especially LM are also looking rather ominous.
This has been a very good rally for the sector and there is room for an extended correction.
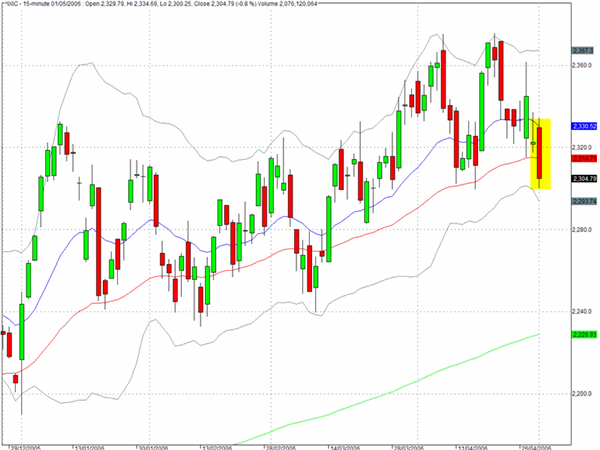
The Nasdaq Composite had a notably weak session yesterday and the index closed below its 50 day EMA and right at the trendline through the recent lows.
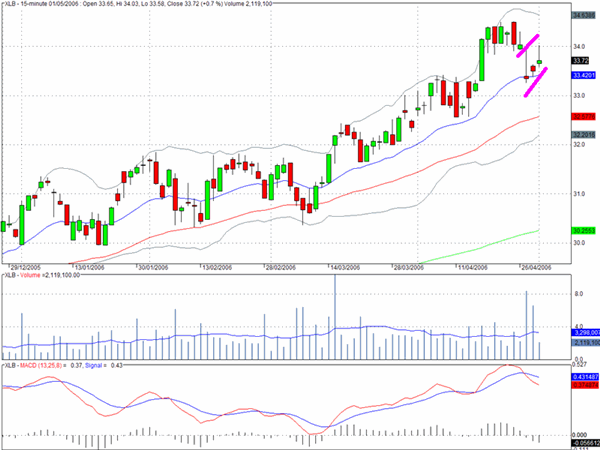
The consumer discretionary sector fund, XLB, experienced two high volume sessions last week and there could be the beginnings of a bearish channel formation. If we were to see a lower high on the recovery effort this would suggest that this sector may come under pressure in coming sessions.
TRADE OPPORTUNITIES/SETUPS FOR TUESDAY MAY 2, 2006
The patterns identified below should be considered as indicative of eventual price direction in forthcoming trading sessions. None of these setups should be seen as specifically opportune for the current trading session.
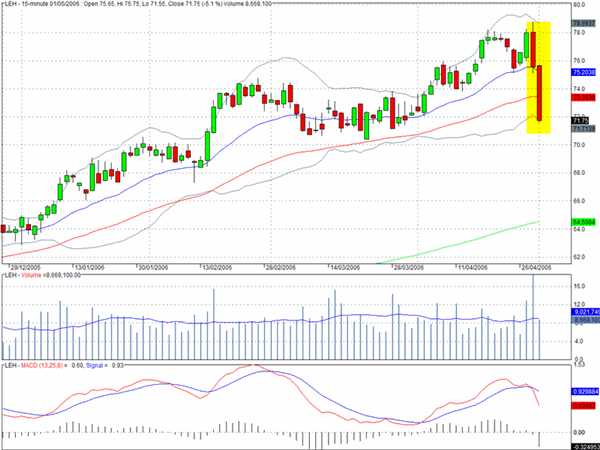
Lehman Brothers (LEH) shows the damage from the last two sessions and while a recovery effort is to be expected, if this attempt to pullback looks unconvincing this would appear to offer an opportunity on the short side.
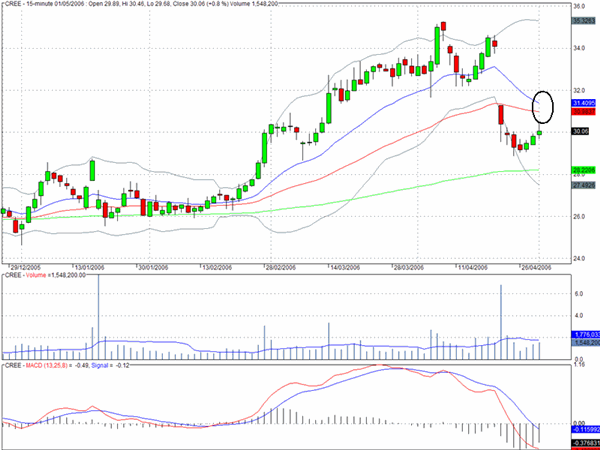
Cree could come under further selling pressure as it approaches the circled area on the chart.
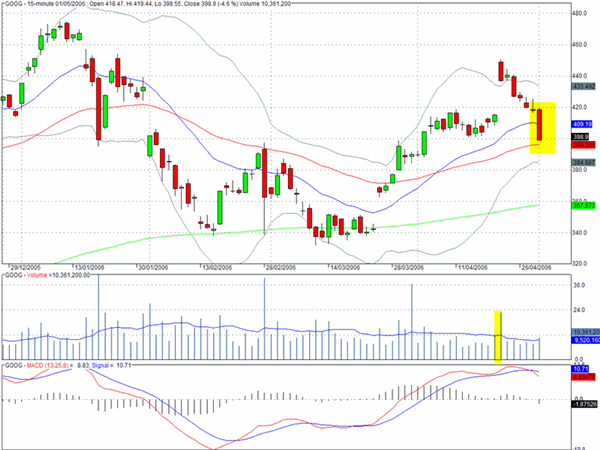
Another chart that caught our attention was for Google (GOOG) which appears to be in the process of creating a failed bull flag formation. It is perhaps too soon to judge but if the failure pattern is confirmed this can often be the precursor to more serious downward pressure ahead.
Clive Corcoran is the publisher of TradeWithForm.com, which provides daily analysis and commentary on the US stock market. He specializes in market neutral investing and and is currently working on a book about the benefits of trading with long/short strategies, which is scheduled for publication later this year.
Disclaimer
The purpose of this article is to offer you the chance to review the trading methodology, risk reduction strategies and portfolio construction techniques described at tradewithform.com. There is no guarantee that the trading strategies advocated will be profitable. Moreover, there is a risk that following these strategies will lead to loss of capital. Past results are no guarante of future results. Trading stocks and CFD's can yield large rewards, but also has large potential risks. Trading with leverage can be especially risky. You should be fully aware of the risks of trading in the capital markets. You are strongly advised not to trade with capital you cannot afford to lose. This article is neither a solicitation nor an offer to buy or sell securities.