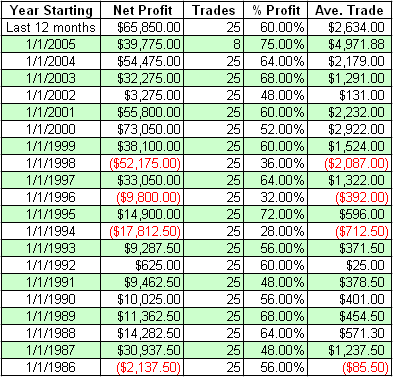
It's generally known that the S&P cash is used as a standard against which other investments are measured. Are you doing better with your program than you would have been just buying and holding the index throughout the given time frame? It's also no secret that, short-term countertrends not withstanding, there is a relentless upward bias to the market which is why the bellwether works.
There is also widespread awareness about how some market timeframes outperform and others underperformâ€"sometimes to the point of negative results. Until recently, you could have made money shorting the market every Fridayâ€"the week's one historic net down day. Also there is a tendency to “paint the tape” at monthly and quarterly ends. That means institutions buy high performing stocks just for the purpose of showing in their prospectuses that they owned them. Never mind that they didn't make money in them or that they're just going to dump themâ€"the whole “window dressing” scam served its come-on purpose.
Sometimes common knowledge actually works in favor of research rather than contrary to it. Here's an example, hereafter referred to as the Monthly Perpetual System:
GO LONG S&Ps ON THE 22ND OF EVERY MONTH (OPEN). (Or, in the event of that date falling on a weekend or holiday, the first possible trading day thereafter). HOLD THE LONG UNTIL THE 7THâ€"REVERSE ON THAT OPEN AND GO SHORT.
Stay perpetually long or short. Figure 1 gives the five-year results in the S&P, Nasdaq, Russell and Dow futures.

The research resulted from (1) confirming the validity of being long around the month's end and (2) demonstrating that the middle of the month was a poor performance time. From there, dates 1 through 31 were optimized, and the results produced many lopsided combosâ€"largely heavily favoring the long side. Such asymmetry is a good way to ensure that you're mining random numbers that won't hold up in the future. The settled-on dates weren't the ultimate best producers, but they did exist within a good neighborhood of positive tests. They also made the long/short durations as close to equal as possible. (Fifteen short days, and 15 or 16 long days depending on whether there is a 31st day. Obviously February's longs get a little short shrifted).
It is believed the tests were done being mindful of drivers (paint-the-tape tendencies) and robustness. The one contract that existed longer than ten years holds up in ancient times as the 20 year S&P chart shows.

Rather coincidently, this page is being posted on the 22nd of the month. We don't actively recommend buys and sells hereâ€"past performance does not guarantee bla bla bla, but uh…this does indicate a buy on Friday's open. For whatever it's worth.
Art Collins is the author of Market Beaters, a collection of interviews with renowned mechanical traders. He is currently working on a second volume. E-mail Art at artcollins@ameritech.net.