NASDAQ Commentary
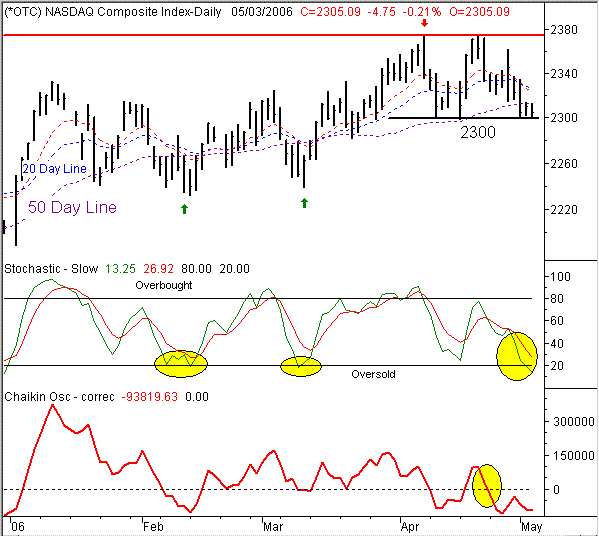
The NASDAQ certainly isn't having its best day today, currently down 4.75 points, trading at 2305.09. That 0.21% slide leaves the composite in the hole by 17.48 points so far for the week, or a 0.75% dip. And more than that, some more technical damage has been done that will make the challenge even bigger for the bulls. On the other hand, we're at a key inflection point.
What's bearish.......
Barring a huge recovery today (which isn't likely), the NASDAQ Composite is on track to make its third straight close under the 50 day moving average, with this one being the lowest of the week. Note that the 50 day line has also served as resistance today and yesterday. The cross under the 50 day is already complete a sell signal - the resistance is just the final blow. And to see it all happen immediately after we made a double-top at 2375 is a hint that the buyers are done for a while....another bearish clue.
What's bullish.......
In a nutshell, the NASDAQ is right at its most likely bounce point. The 2300 level served as a springboard three times in the last few weeks, and today's low of 2300 again tells us that the market is not going to give this ground too easily. It truly is the front line of the war, and the bulls have successfully defended their ground each time it's been approached. Plus, we're close to being stochastically oversold, which has tended to encourage a buying effort over the last few months.
Our take........
Given the current scenario, we'd have to say that the bears are going to win this battle, and send stocks lower over the course of the next few days. More than that, the odds are that such weakness will end up turning into an intermediate-term trend. Investors are already sitting on some Q1 gains, and the NASDAQ has put a little distance between its current level and its 200 day average at 2224 (not shown).
All things eventually return to their mean (long-term average), so we expect to see the NASDAQ fall back to that long-term line. BUT, all of that really is dependent on actually getting that break under 2300.
NASDAQ Chart

S&P 500 Commentary
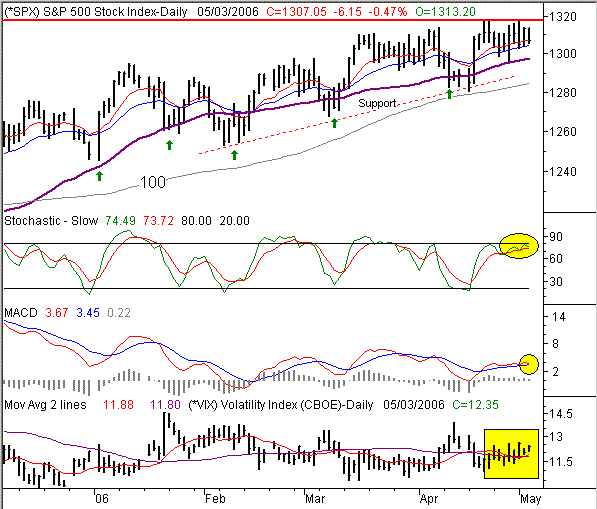
The S&P 500 is struggling even more than the NASDAQ is today, down 0.47%, currently trading at 1307.05. That leaves it down by 3.55 points for the week. However, for the week so far, it's only down by 0.27%. So, all of that weekly loss came today. In any case, despite the fact that the SPX has remained relatively stronger than the NASDAQ, it looks like it's still headed into trouble.
Yes, the S&P 500 is still above the 20 day moving average, and is almost still above the 10 day line. So how can we be tilted on the bearish side of things? There are a few red flags. The first one is the double top at 1318. We're also on the verge of a bearish MACD crossunder. And despite the fact that the S&P 500 really hasn't gone anywhere since early April, the index has somehow gotten stochastically overbought. All of those things are starting to weigh in on trader's minds - and this chart.
On top of all that, it also looks like the CBOE Volatility Index (VIX) is back on the rise. It smoothly crossed above its 10 and 50 day moving averages on Monday. That's another technical sell signal that has actually been a pretty effective indicator of short-term tops recently. One notable difference this time with the VIX is that it really hasn't blasted past its moving averages. The last few times the VIX pushed higher, it traveled a long distance in a short time. This time though, it just drifted upward. That has kept any correction pressure away, and has allowed stocks to just dwindle lower. Without any massive single-day plunges, there haven't been any massive market buy-backs. Instead, stocks have just quietly fallen. The point is, the short-term bear signal could actually be the beginning of an intermediate-term bearish trend, and investors may not even realize it.
That said, don't get too bearish yet. There's a virtual zone of support lines all the way between 1285 and 1307. Any of them could trump this bearish outlook. But in either case, we still think we're due for at least a small correction as the SPX falls back to the lower edge of its trading channel.
S&P 500 Chart

Price Headley is the founder and chief analyst of BigTrends.com.