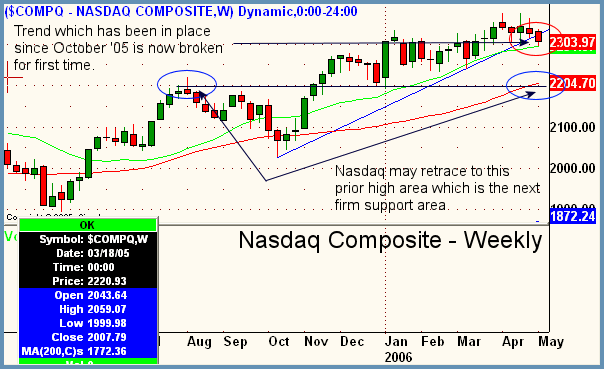
Good Morning, Traders. Mildly negative day in the markets on Wednesday as economic data and a dropoff in crude prices due to oil supply inventory reports from the Department of Energy failed to get the market moving much at all. In the ShadowTrader Professional Traders SquawkBox we coined a new term for inside days which we call Russian Doll days. Like a Russian doll in which subsequently smaller and smaller dolls fit into larger ones, the market has made two inside days in row where current day price action has been completely enveloped by the prior day. This indicates a contraction in volatility which of course means that an expansion is just around the corner. Yippee! The question is in which direction will that volatility occur? As usual the picture is mixed. While the S&P and Dow continue to look bullish, the Nadsaq continues to show chinks in its armor. The snapshot below of the weekly Nasdaq Composite is important in that it shows a clear trendline break in this index of a trend which has been in place for seven months. Although we won't know until Friday whether or not this weekly bar closes below the trendline, the fact that daily bars are starting to close below it is certainly bearish for the Nasdaq. As annotated below, the next support level would be the prior swing highs of August 2005 at the 2204 area where old resistance will now become new support. This would make sense as the 50ma (red) weekly is also rising to meet price action at that same area. We'll know more at the end of the week. For now same situtation....Dow and S&P intact, Nasdaq showing some signs of tiring.

Peter Reznicek is the Chief Equity Strategist and a principal of the Prana Fund, a domestic hedge fund, and ShadowTrader, a subsidiary of thinkorswim which provides coaching and education to its clients on both intraday and swing trading of equities. For a free trial to the full version of The Big Picture or to learn about ShadowTrader's other services, visit shadowtrader.net or send an email to preznicek@shadowtrader.net.