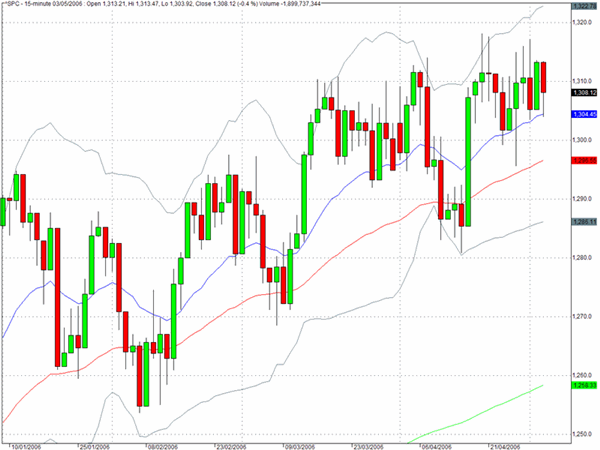
After closing on Tuesday at a multi-year high, the S&P 500 slipped back below the 1310 level to close at 1308 down 0.4% on the day. The DJIA slipped very slightly but still seems to be the index that is worth watching as the assault on the all time high will continue to be a focal point for traders in coming sessions.
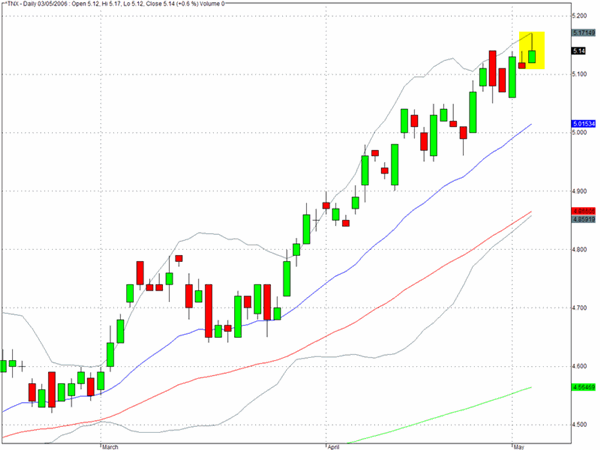
The yield on the ten year note (^TNX) seems not to have stabilized at the five percent level as some commentators had predicted and yesterday we closed with a yield of 5.14% which is the highest level in almost four years. In our weekend commentary we will review some longer term charts and try to identify some other thresholds that may now become targets in the coming weeks.
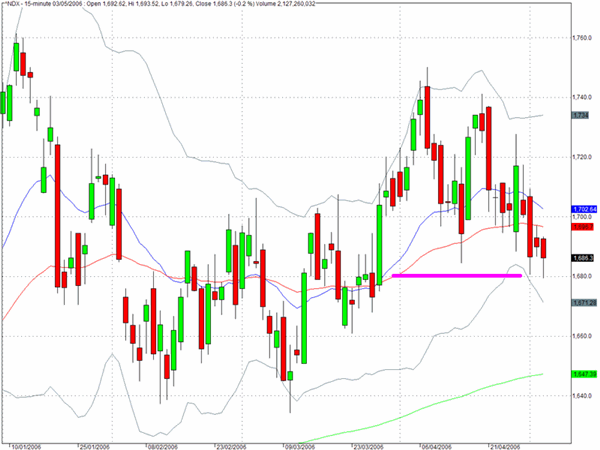
The Nasdaq 100 cash index (^NDX) had another day of underperformance and in yesterday√Ę‚,¨‚"Ęs trading the index reached down just below the critical 1680 level. Whether this constituted a successful test of support and clears the way for another possible move up may become clearer in today√Ę‚,¨‚"Ęs trading.
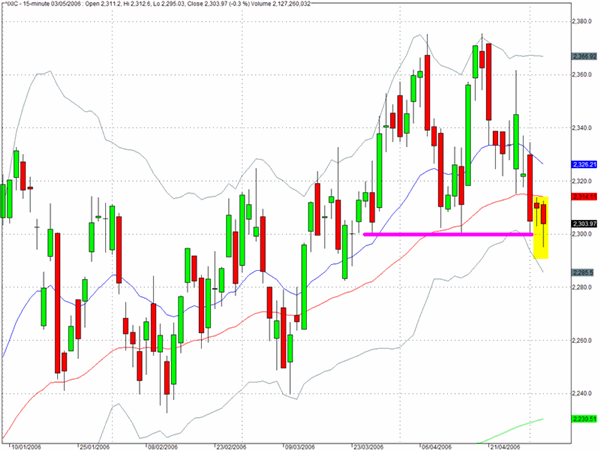
The broader Nasdaq Composite index (^IXIC) also dropped below the 2300 level in yesterday's trading but closed just above it at 2303. The most recent high was achieved on April 19th at 2370 which is exactly three percent from where we closed yesterday.
TRADE OPPORTUNITIES/SETUPS FOR THURSDAY MAY 4, 2006
The patterns identified below should be considered as indicative of eventual price direction in forthcoming trading sessions. None of these setups should be seen as specifically opportune for the current trading session.
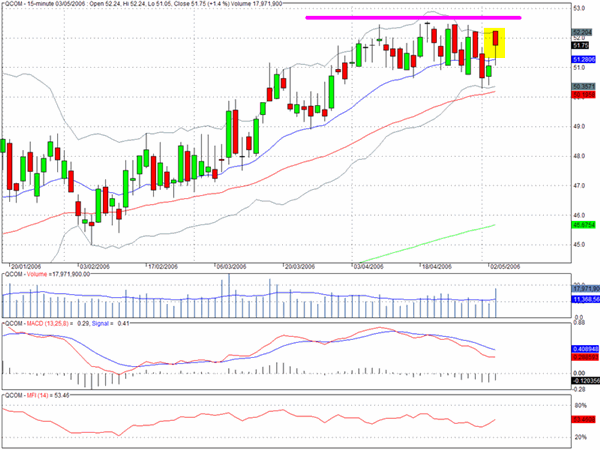
In addition to the problems that Microsoft is having and the poor performance from Intel, a good illustration of the difficulties that the big Nasdaq names are having is seen in the chart for QCOM below. The stock has hit resistance above $52 and is not showing any obvious evidence that it can pentrate this level.
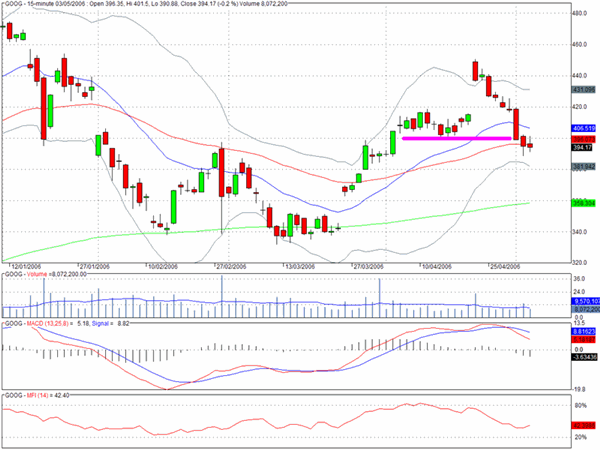
We commented on the chart for Google (GOOG) earlier in the week and suggested that the formation was beginning to appear as a bull flag failure pattern. Yesterday's close sits below the level at which the flag pole would have formed and also right on the 50 day EMA. We could see a resolution of the pattern today.
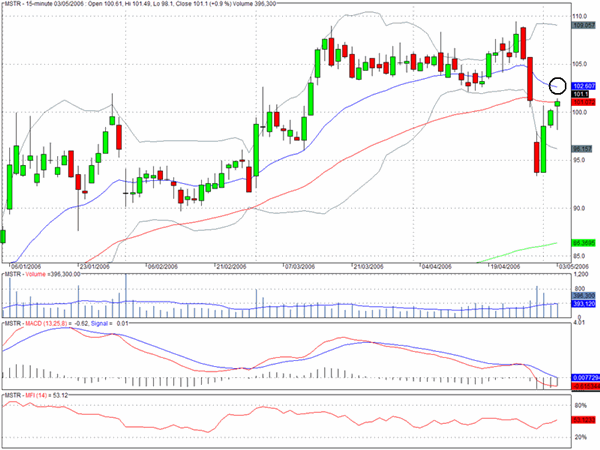
Microstrategy (MSTR) has put in a good recovery effort following the big drop on April 28th and as it approaches the circled area some further weakness could appear.
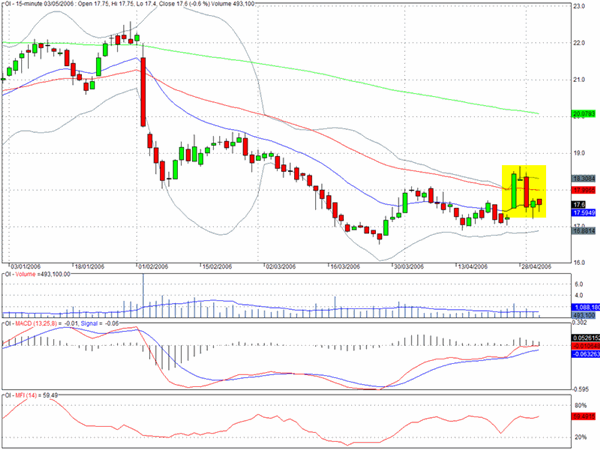
Owens Illinois (OI) looks as though it will follow through on its recent breakout effort.
Circuit City (CC) looks rather extended and momentum is fading.

Clive Corcoran is the publisher of TradeWithForm.com, which provides daily analysis and commentary on the US stock market. He specializes in market neutral investing and and is currently working on a book about the benefits of trading with long/short strategies, which is scheduled for publication later this year.
Disclaimer
The purpose of this article is to offer you the chance to review the trading methodology, risk reduction strategies and portfolio construction techniques described at tradewithform.com. There is no guarantee that the trading strategies advocated will be profitable. Moreover, there is a risk that following these strategies will lead to loss of capital. Past results are no guarante of future results. Trading stocks and CFD's can yield large rewards, but also has large potential risks. Trading with leverage can be especially risky. You should be fully aware of the risks of trading in the capital markets. You are strongly advised not to trade with capital you cannot afford to lose. This article is neither a solicitation nor an offer to buy or sell securities.