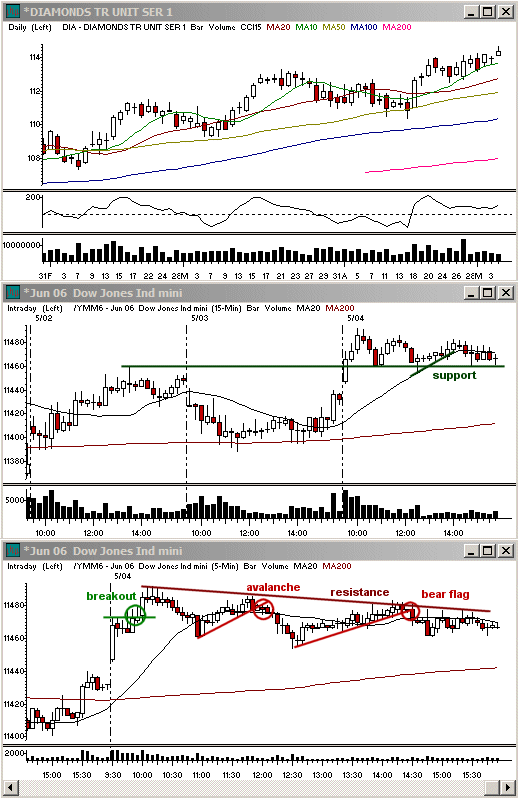
Good morning! The market put in another primarily range-bound day on Thursday. The morning upside continuation we were watching for heading into the day followed through very quickly out of the open. After an initial surge took the Nasdaq into Tuesday's highs and closed the gap in the S&P 500, the market rested for about 15 minutes before leading into new intraday highs. This took the Dow Jones Industrial Average once more to new yearly highs. At the same time, the highs of the S&P 500 range managed to hold as the market turned over out of the 10:15 ET reversal period.
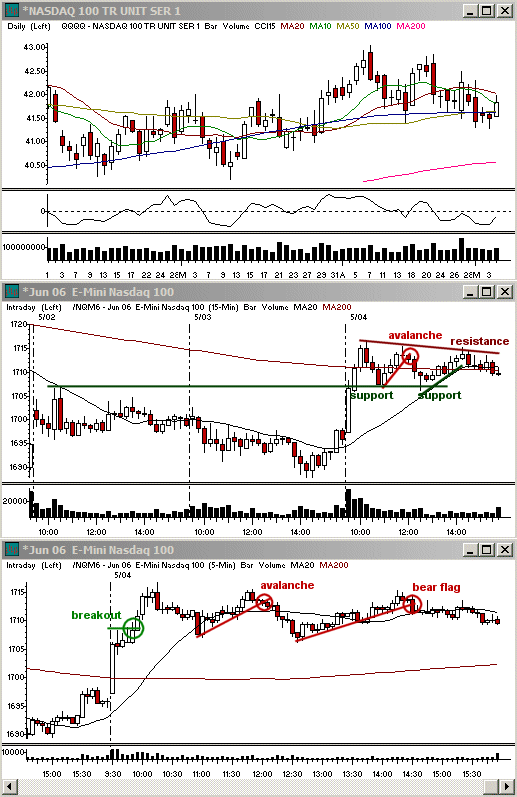
The market turned quickly off its 10:15 ET highs. With a move that was about average in terms of pace, it created higher odds for more of a trading range day with a slightly bearish tilt. The S&P 500 actually followed through the best with the pullback action. It held the 5 minute 20 sma with the least amount of retracement back to highs. This created an Avalanche on the 5 minute charts, leading to a solid drop into noon. The Dow and Nasdaq Composite bounced more out off 11:00 ET and hence were only able to put in slightly lower lows when breaking down at noon. They found support at their 15 minute 20 simple moving averages.
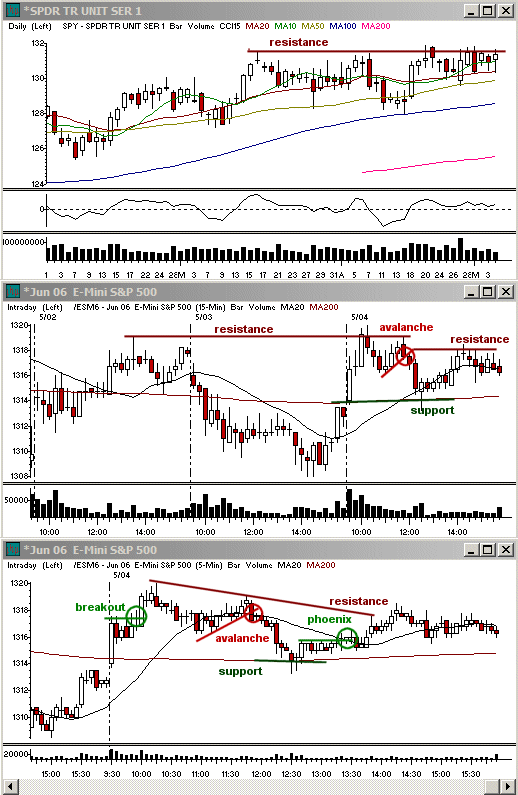
Following this second descent intraday, the volume in the market dropped off. The indices slid up the 15 minute 20 sma, holding the range for the remainder of the day. The upper trend channel hit just before 14:30 ET, creating the last pivot intraday on the 5 and 15 minute charts. With the employment data due out ahead of the open on Friday though, many traders seemed unwilling to show a strong bias into the close and the market quickly fell flat. The day ended with the S&P 500 up 4.4 points, the Dow up 38.58 points and the Nasdaq up 19.93 points off Wednesday's close.
The indices are still looking more bullish on Friday. A lot of that will depend on the morning numbers. So far this week there have been enough breakouts on the daily and weekly charts to keep things interesting even though the market as a whole has been rather slow. With fewer earnings releases and other news events on Fridays, however, I expect fewer of such setups as well.
Economic Reports and Events
May 05: Average Workweek for Apr (8:30 am), Hourly Earnings for Apr (8:30 am), Nonfarm Payrolls for Apr (8:30 am), Unemployment Rate for Apr (8:30 am), Consumer Credit for Mar (15:00 pm)
May 08: -
May 09: Wholesale Inventories for Mar (10:00 am)
May 10: Crude Inventories 05/05 (10:30 am), FOMC policy statement (14:15 pm)
May 11: Business Inventories for Mar (8:30 am), Initial Claims 05/06 (8:30 am), Retail Sales for Apr (8:30 am), Retail Sales ex-auto for Apr (8:30 am)
May 12: Export Prices ex-ag. for Apr (8:30 am), Import Prices ex-oil for Apr (8:30 am), Trade Balance for Mar (8:30 am), Mich. Sentiment-Prel. for May (9:50 am
Earnings Announcements of Interest
Only stocks with an average daily volume of 500K+ are listed. List may not be complete so be sure to always check your stock's earnings date before holding a position overnight. (A) = Earnings after the close, (B) = Earnings before the open, (?) = Earnings time not specified at the time of this writing
May 05: AGU (?), CRK (?), EP (B), EOG (?), GSX (?), HMY (?), MHS (B), NSR (B), SNY (?), THQI (B)
May 08: ABP (B), ARXX (?), AVNX (?), BBD (?), BLKB (A), CSV (A), CCRT (A), EAGL (A), FLR (A), FTI (A), FTO (?), HW (B), HNT (?), HOC (B), IN (A), MYOG (?), OSIP (A), GOLD (02:00 am ET), SBAC (A), SONS (A), STO (2:30 am ET)
May 09: SIL (?), AZPN (A), ASYT (4:00 pm ET), BIDU (A), ITU (?), CELL (A), CVC (B), CSCO (?), DESC (A), DYN (B), ENTG (B), FCH (A), GTI (B), HSP (B), IDTI (A), LAMR (?), MTSN (A), MYL (A), NMTI (B), PGN (10:00 am ET), SAPE (A), SLE (?), SINA (A), TMTA (A), LCC (B), DIS (?), WGR (B), WFII (A)
May 10: WEL (?), RIO (?), DCEL (?), DQE (B), ENER (?), HJT (B), GSS (A), IVAN (?), MIR (?), MT (?)
May 11: AEM (A), BGO (A), DT (?), EXPE (A), JCP (?), KSS (?), PBY (A), UBB (?), URBN (06:00 am ET)
May 12: DRS (B), PBR (?)
Note: All economic numbers and earnings reports are in lines with those compiled by Yahoo Finance. Occasionally changes will occur that are made after the posting of this column.
Toni Hansen is President and Co-founder of the Bastiat Group, Inc., and runs the popular Trading From Main Street. She can be reached at Toni@tradingfrommainstreet.com.


 Free Festival of Traders Videos