The market remains range-bound and the epitome of "no follow-through." This week was a classic example. The market was stable on Monday, until Fed Chairman Bernanke indicated that the market had made too bullish of an interpretation of his statements last week. That caused the market to sell off sharply on Monday. But then it rallied on Tuesday, after some strong buying Asian markets on Monday night. In fact, that night $SPX closed at a new multi-year high of 1313. However, Wednesday saw another decline, as the market couldn't follow-through on Wednesday's strong finish. Finally, Thursday saw another rally, albeit not back to new highs.

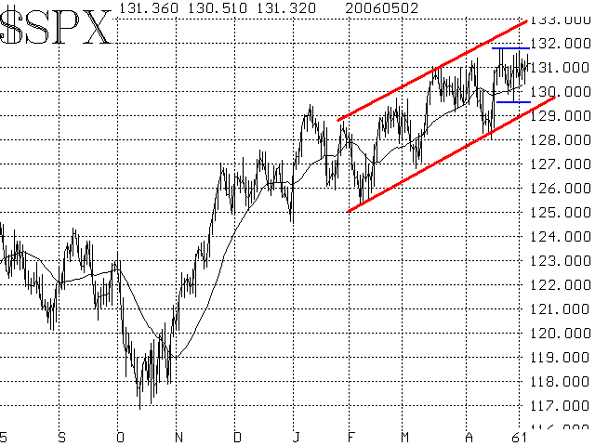
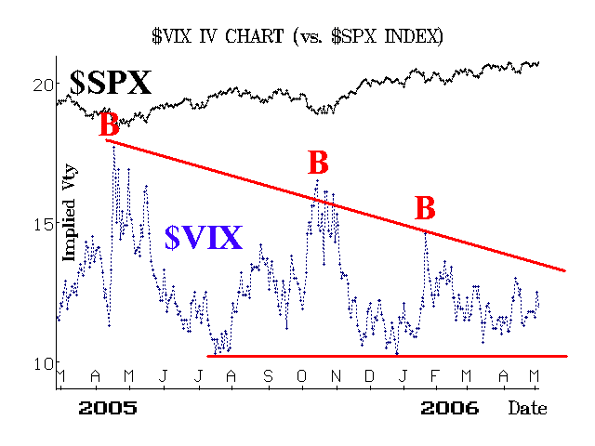
On the very near term, $SPX has not closed above 1313 nor below 1302 in nearly three weeks. Taking a slightly longer-term view, $SPX except for 4 days in mid-April -- has been contained within a range of 1294 - 1318, intraday, since mid-March. That is an extremely long time to have gone "nowhere," and it certainly explains why $VIX is so low. Speaking of $VIX, it has edged up a little from its recent lows, but continues to hover near 12 -- not exactly a clear signal in either direction. Earlier in the week, it had risen, and there was some speculation that it might be registering a sell signal in advance of Friday's Unemployment Report, but that did not pan out.
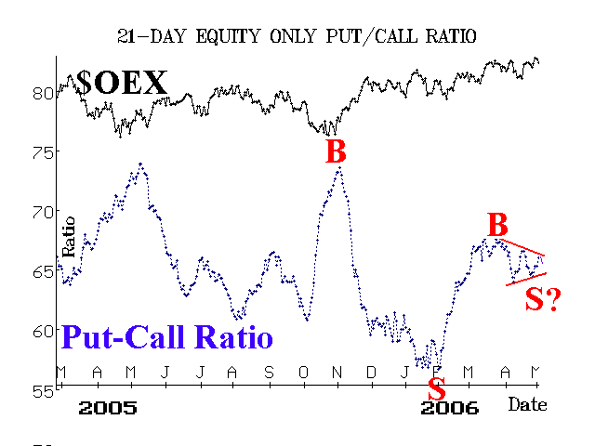
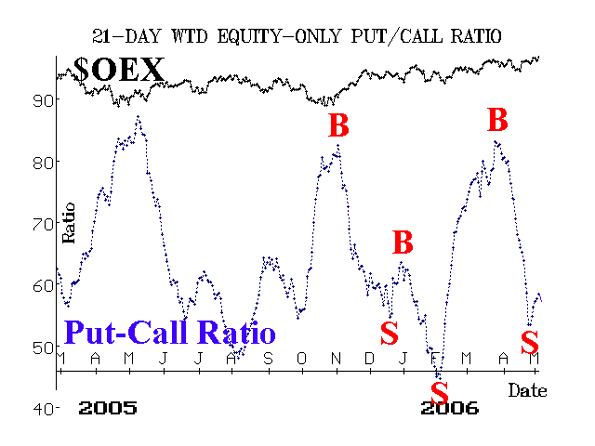
Technically, both equity-only put-call ratios are now on sell signals, although both wavered some on Thursday. The standard ratio (Figure 2) was the latter of the two to confirm a sell signal, but it is really just locked in a narrowing range, and is probably not interpretive until it breaks out one way or the other. An upside breakout by the put-call ratio would be a sell signal for the broad market, while a downside breakout would be bullish for the broad market.


Finally, breadth has been rather mediocre. In general, breadth has not been particularly predictive for quite some time now, as it flops back and forth with the wavering whims of the market.

We continue to view the broad market as being trapped within its range -- either the horizontal range outlined in blue in Figure 1 or the slowly rising range outlined in red.
Lawrence G. McMillan is the author of two best selling books on options, including Options as a Strategic Investment, recognized as essential resources for any serious option trader's library. Sign up today and take an extra 10% off tuition for Larry's 2-Day Intensive Options Seminar on May 20 & 21 in Houston.