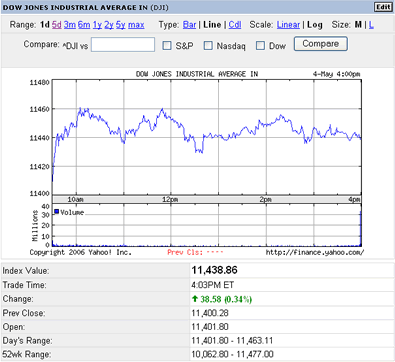
Markets were mixed throughout the day yesterday. Strong earnings from retailers helped fuel positive momentum. The Dow, NASDAQ, and S&P all closed higher.
This morning's highly anticipated April employment data was mixed. Non-farm payrolls reported less than expected, creating 138,000 jobs versus the 200,000 consensus. Average hourly earnings increased 0.5%, beating the consensus of 0.3%. U.S. stock futures are trading higher on the data, suggesting the market believes the decrease in jobs created means the Fed will indeed pause rate hikes after the May 10 Fed policy meeting. What the market may be overlooking is the fact that employers are paying workers more money according to the hourly earnings data. This may result in companies being forced to raise prices in order to stay in line with profits. That translates into inflation, which is the Fed's #1 priority to tame.

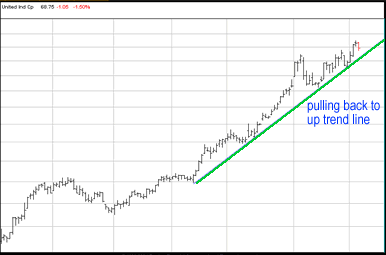
United Industrial Corp (NYSE: UIC) looks as if it could meet trend line support any day now. The stock resides in the Aerospace and Defense Industry, which has performed very well for investors over the past few years. This bullish Industry is not finished moving higher in my opinion, and opportunities to buy on pullbacks to the trendline should not be overlooked.

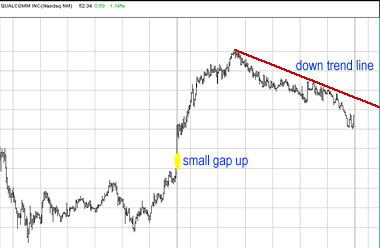
I recently wrote an article reflecting my bullish stance on Qualcomm, Inc (NASDAQ: QCOM). The stock has since popped up nicely proving. I believe the stock still has room to run, but may require some downside intraday action first.

Yesterday, the stock opened higher than the previous day's close creating a small gap up. This gap looked as if it would hold until about noon, when QCOM began reversing. From that point, the stock began downtrending towards the gap, appearing as if it had every intention of filling it. The stock then found support at 52.20 near the end of the trading session and formed what could be a potential double bottom. A break through of the neck line at 52.35 would be a bullish sign for QCOM, but if the stock moves lower off the 52.35 resistance, it could fill the small gap before moving higher.
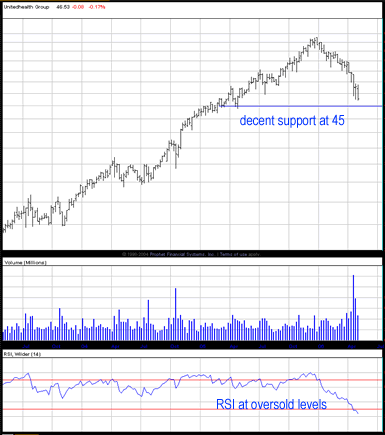
UnitedHealth Group Inc (NYSE: UNH) has really taken a beating since reversing direction late December. The stock has done nothing but tank, and has done so in an increasingly aggressive manner. So why would I suggest it may be time to start looking at the stock?

It's not everyday that you see RSI at levels this low on a 3-year daily bars chart. RSI is an indicator that suggests when a stock may be oversold or overbought. UNH has just fallen below 30 and is headed for 20, suggesting that the stock is indeed trading at bargain prices. It would be a little different if we were talking about a company with poor management, insignificant products, fraudulent accounting rumors, etc., but we're not.
Andy Swan is co-founder and head trader for DaytradeTeam.com. To get all of Andy's day trading, swing trading, and options trading alerts in real time, subscribe to a one-week, all-inclusive trial membership to DaytradeTeam by clicking here.