NASDAQ Commentary
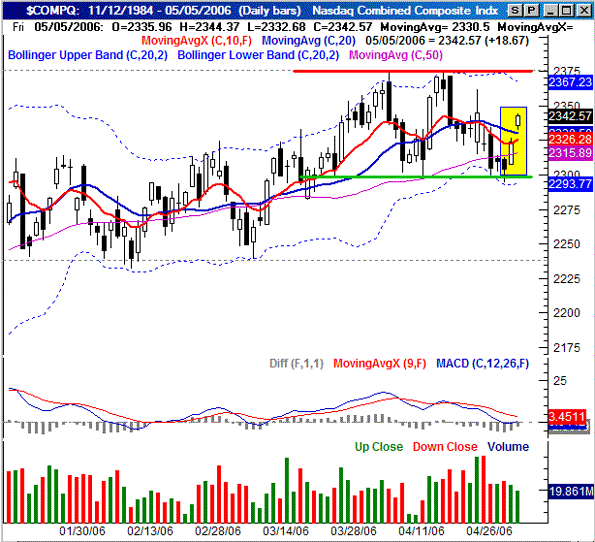
The NASDAQ Composite managed to pull itself up by the bootstraps, ending the week at 2352.47 after reaching as low as 2295.03. The 20.0 points gain (+0.86%) was a small victory for the bulls. However, there are still a couple of issues the bulls must contend with. First, we still saw lower lows and lower highs for the week. And second, why isn't the NASDAQ at new highs like the other indices?
In almost all instances, the NASDAQ should lead the market. In simplest terms, it's not doing so right now. That's why we're still suspicious of the market's recent strength. Not only did the NASDAQ have a weaker Friday and a weaker week than the S&P 500, it's still nowhere near new multi-year highs.....something the Dow and the S&P 500 have had no trouble making. The point is, this is either a hollow rally, or the beginning of a very unusual kind of bullishness.
The more immediate concern for the bulls, though, is the combination of Friday's bullish gap and weaker volume. Thursday's high of 2326.82 was 6 points under Friday's low of 2332.68. Knowing that it's a rarity for a gap to go 'unfilled', the odds favor a back-tracking for the NASDAQ Composite. And as far as the bulls are concerned, the sooner the better. Adding to that expectation of a short-term dip is that Friday's big gain was on the lowest volume of the week. In fact, despite the fact that the composite is higher than it was last week, the buying volume has remained generally unimpressive.
All in all, we have to at least look for that gap to get filled. But beyond that, we still have bearish concerns. Namely, while other indices have not done so, the NASDAQ has technically made a lower major low after failing to make a higher high (at 2375). There are just too many hints that traders aren't nearly as interested in stocks as they superficially seem to be.
In the meantime, support is still at 2300, while resistance is at 2375. >From a bigger-picture view, only a break outside of that zone would be a significant signal that the NASDAQ was finally on the move again.
NASDAQ Chart

S&P 500 Commentary
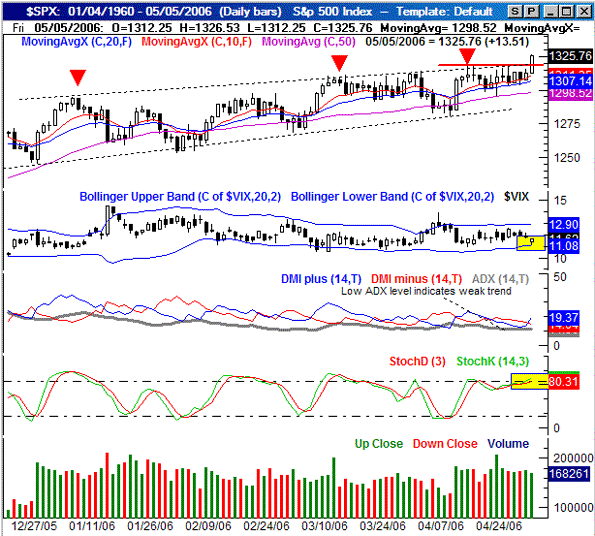
The SPX hit new multi-year highs on Friday, in a big way. Gaining 15.15 points (+1.16%) for the week left it at 1325.75....well above resistance that had been forming around 1318. But can Friday's big move produce any follow through? Momentum wise things look bullish, but there are some other things we need to look at that could weigh in on the market.
Yes, the entry into new territory is theoretically bullish, and we're supposed to 'buy' on new highs. However, we'll remind you that we've seen new highs several times this year, and the responses has never been overwhelmingly bullish. In fact, each of those new highs was usually met with a selloff a few days later (see the red arrows). One could make the argument that since that resistance line (dashed) at 1318 has been broken, then the old assumptions don't apply any more. That logic isn't bad actually, but there are still too many things that make a dip likely.
First and foremost is the CBOE Volatility Index (VIX). See how it touched its lower Bollinger band (20 day) on Friday then bounced off of it? For months now, this has been the point when the buying eased up and the selling began. Not that it's ever been a major selloff, but the result is usually about a 25 point correction.
Secondly, note that we're stochastically overbought again. It's possible to get overbought and stay overbought for weeks (if not months) on end, but based on recent history, we have no real reason to think this is going to be one of those times. Instead, we're still looking for the SPX to fall back after Friday's big surge. Keep in mind, however, that the current momentum may still be able to carry the S&P 500 just a tad higher before it begins.....for a couple of days.
That said, be sure to read our 'Bottom Line' comments below.
S&P 500 Chart

Bottom Line
The market dynamic has been very odd lately, with things being bullish overall, and led by the wrong indices. And with the market being very choppy and mostly inefficient, it's only been more tricky. Ultimately, there are two scenarios we're facing. With the 'worst six months' officially started, the market should start to sag as we largely described above. The other possibility is that we're all set for a surprisingly bullish year that defies the odds, and the calendar. Any mid-year strength will be fueled by the Fed's easing of interest rates. And after some poor payroll and confidence numbers, the Fed may finally be able to safely do that. If and when that happens, look for the market to rally. That euphoria will be dangerous, but it could still be one heck of a bullish run. In fact, the strength at the end of this past week may have been some buying action with that very scenario in mind. We think it was a bit premature to make that bet, though. Keep an eye on the VIX in the meantime, as well as support and resistance for the NASDAQ.
Price Headley is the founder and chief analyst of BigTrends.com.