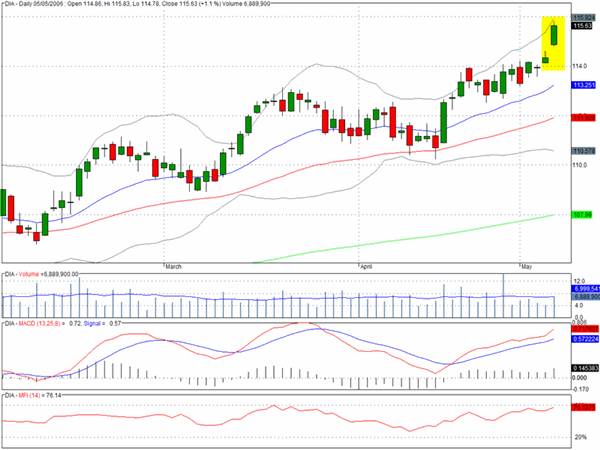
With Friday's 1.2% surge the Dow Jones Industrials now lies less than 150 points from its all time closing high of 11,722 achieved in January 2000. It has been apparent for some time that this target was proving to be too much of a temptation for traders to resist and Friday's data seems to have provided exactly the excuse required to ratchet up the challenge.
For the sceptics who wonder just how satisfying the achievment will be when it arrives, Friday was a day to step aside. Just how many patient sceptics there are remains to be seen.
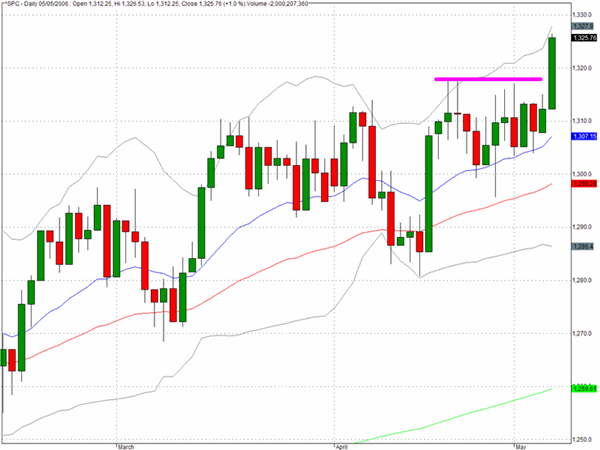
The other most notable feature from Friday's trading was seeing the S&P 500 finally break through the strong resistance that it has encountered for several weeks between 1310 and 1320. Friday's close at 1325 allowed it to close at a new multi-year high, and with the DJIA clearly on a mission we should expect this index to move somewhat higher before the determination of the bulls is properly tested.
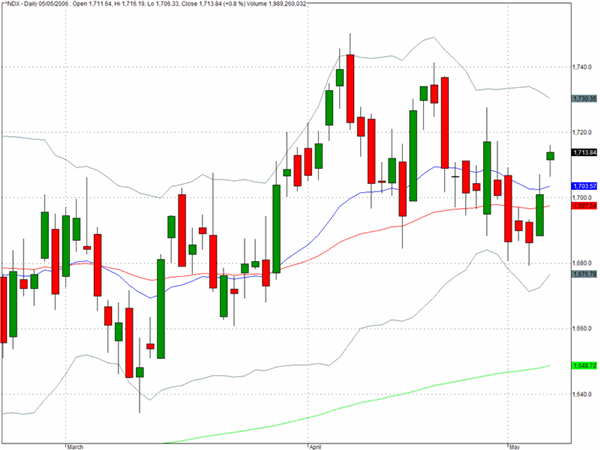
The Nasdaq 100 index (^NDX) managed to gain 0.8% in Friday√Ę‚,¨‚"Ęs trading but as the chart reveals there is still some way to go before we regain the highs set in early April let alone the highs above 1760 from early January.
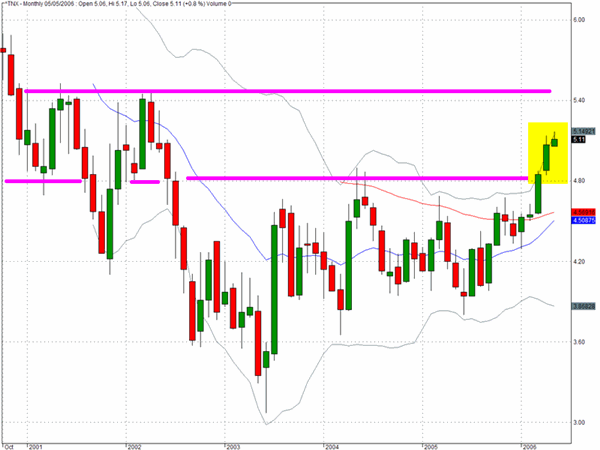
With all of Friday's enthusiasm about the possibility that the Fed may be almost done we thought it might be useful to see if the charts for long term rates may offer clues as to where we may be headed. The ten year note is considered the benchmark for longer term rates and the chart below shows the monthly yields since late 2000. Two bands are discernible on the chart one around 4.8% and the other around 5.5% and at present we are almost in the middle of that zone. There is clearly nothing magical about either of these rates and we may well stabilize at the 5% level which we suspect is what the markets are discounting.
What does seem evident from the monthly charts is that the break above 4.8% took some time to achieve and over the last two months it has not been obvious that the markets were satisfied with yields of 5%. The Chinese central bank hiked rates recently and the Japanese central bank have terminated their easy money policy. Although there are some indications that commodity prices may have become somewhat overstretched on the upside, there is also the view that once a bull market develops in industrial commodities it can run for a very long time and this is perhaps why the gold market has sprung to life. An even more important factor for the Federal Reserve to monitor are the dollar cross rates with the yen and the euro. With the recent declines in the dollar and the large trade deficits the possibility of import based inflation has to be added to the risks of a domestic economy running at close to full capacity.
TRADE OPPORTUNITIES/SETUPS FOR MONDAY MAY 8, 2006
The patterns identified below should be considered as indicative of eventual price direction in forthcoming trading sessions. None of these setups should be seen as specifically opportune for the current trading session.
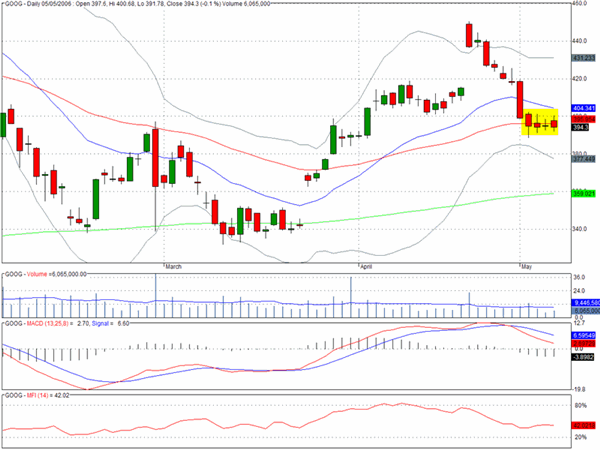
As we commented last week, the chart for Google continues to intrigue us as it failed to rally on Friday and seems to be in suspended animation with a failed bull flag formation still a distinct possibility.
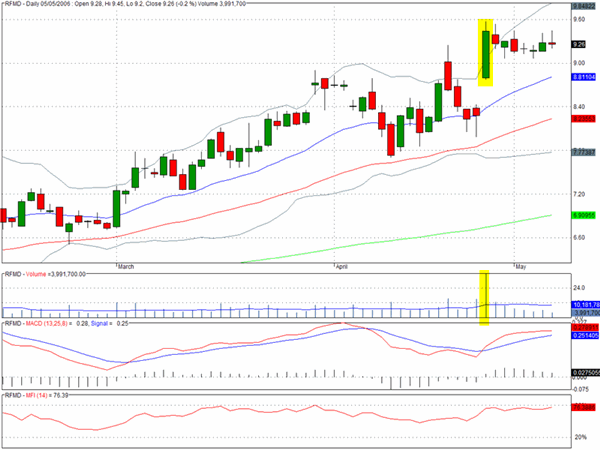
RFMD could be preparing to resume its upward momentum from its strong showing on April 26.
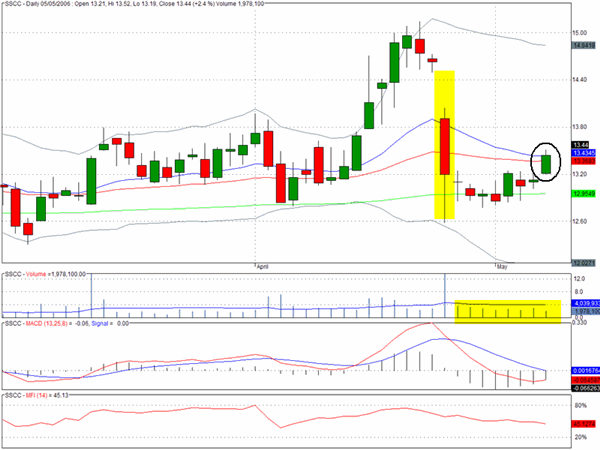
SSCC could be vlumnerable to further selling pressure.
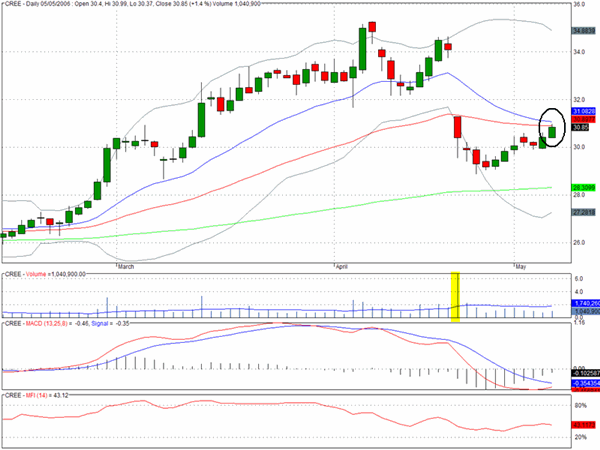
CREE also may have recovered (on very modest volume) to a point where sellers will re-appear.
Clive Corcoran is the publisher of TradeWithForm.com, which provides daily analysis and commentary on the US stock market. He specializes in market neutral investing and and is currently working on a book about the benefits of trading with long/short strategies, which is scheduled for publication later this year.
Disclaimer
The purpose of this article is to offer you the chance to review the trading methodology, risk reduction strategies and portfolio construction techniques described at tradewithform.com. There is no guarantee that the trading strategies advocated will be profitable. Moreover, there is a risk that following these strategies will lead to loss of capital. Past results are no guarante of future results. Trading stocks and CFD's can yield large rewards, but also has large potential risks. Trading with leverage can be especially risky. You should be fully aware of the risks of trading in the capital markets. You are strongly advised not to trade with capital you cannot afford to lose. This article is neither a solicitation nor an offer to buy or sell securities.