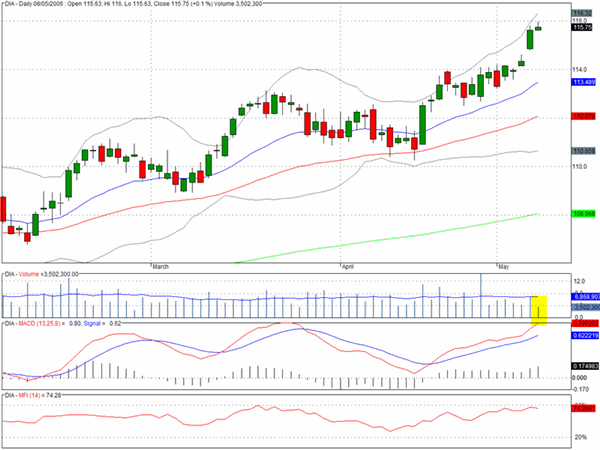
It was a quiet session yesterday with subdued volume and little change in the picture for the major indices following on from last Friday's rally. The DJIA did manage to move very slightly forward but as the chart for the proxy DIA shows the volume was less than half of the 15-day moving average.
Iran may come back into focus today but most traders will be on hold waiting for the FOMC announcement tomorrow.
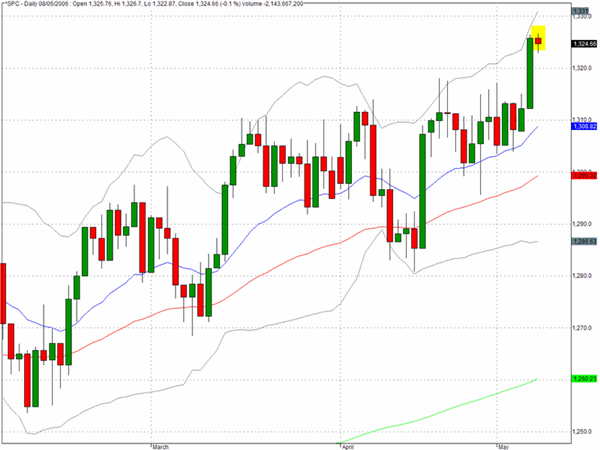
The tiny candlestick formation on the chart for the S&P 500 reveals what was essentially an uneventful session with little new information to digest after Friday's break above resistance.
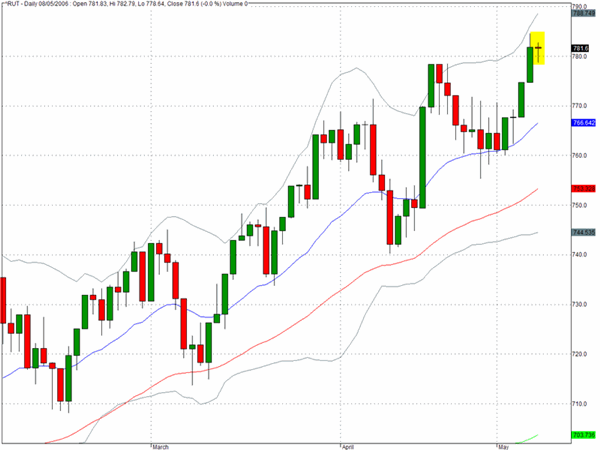
The Nasdaq Composite and the Nasdaq 100 made a little progress yesterday but the action (or lack of it) for the Russell 2000 was very similar to that of the S&P 500. It will be important to see how the smaller cap stocks respond to the interest rate guidance and also to the attempts that traders will be making to record a new high on the DJIA. Should we see the Russell 2000 begin to diverge from the big blue chip stocks that would suggest that the three year trend of outperformance by the small and mid cap sectors may have run its course.
TRADE OPPORTUNITIES/SETUPS FOR TUESDAY MAY 9, 2006
The patterns identified below should be considered as indicative of eventual price direction in forthcoming trading sessions. None of these setups should be seen as specifically opportune for the current trading session.
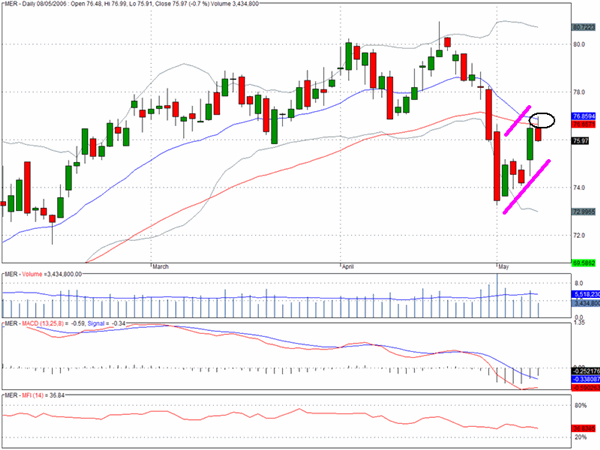
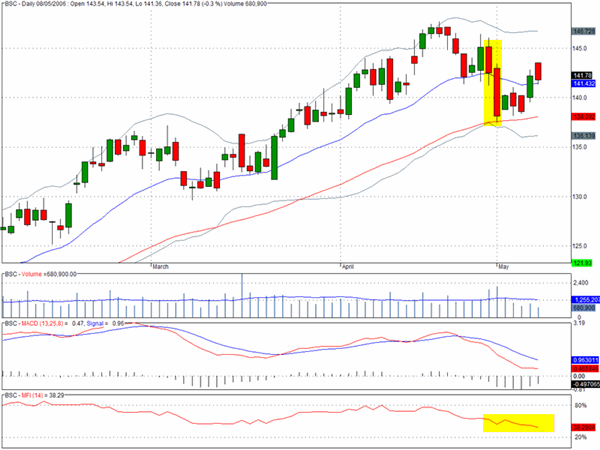
Many of the brokers and investment banks appear to be in the process of creating bear flag formations. Perhaps the most striking is for Merrill Lynch .
Also in a similar vein is the chart for Bear Stearns (BSC).
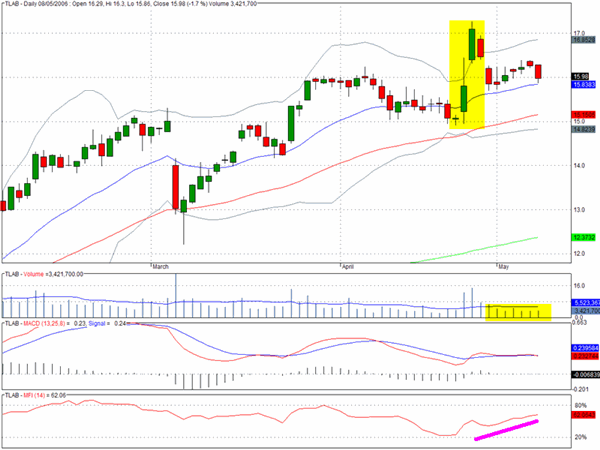
TLAB could be preparing to resume its upward breakout bias.
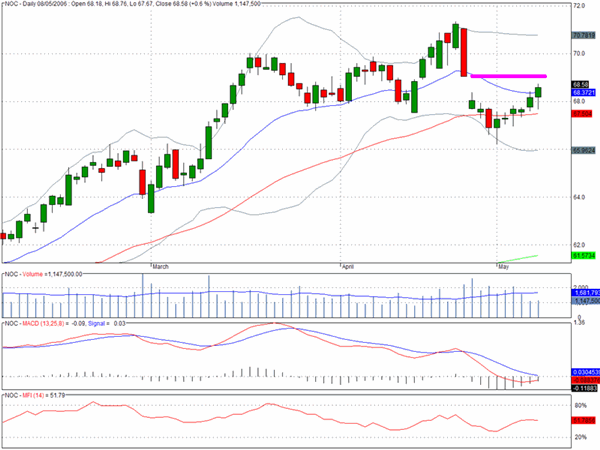
Northrop Grumman (NOC) is approaching the level where it gapped down following the long red bar on April 25th.
Clive Corcoran is the publisher of TradeWithForm.com, which provides daily analysis and commentary on the US stock market. He specializes in market neutral investing and and is currently working on a book about the benefits of trading with long/short strategies, which is scheduled for publication later this year.
Disclaimer
The purpose of this article is to offer you the chance to review the trading methodology, risk reduction strategies and portfolio construction techniques described at tradewithform.com. There is no guarantee that the trading strategies advocated will be profitable. Moreover, there is a risk that following these strategies will lead to loss of capital. Past results are no guarante of future results. Trading stocks and CFD's can yield large rewards, but also has large potential risks. Trading with leverage can be especially risky. You should be fully aware of the risks of trading in the capital markets. You are strongly advised not to trade with capital you cannot afford to lose. This article is neither a solicitation nor an offer to buy or sell securities.