NASDAQ Commentary
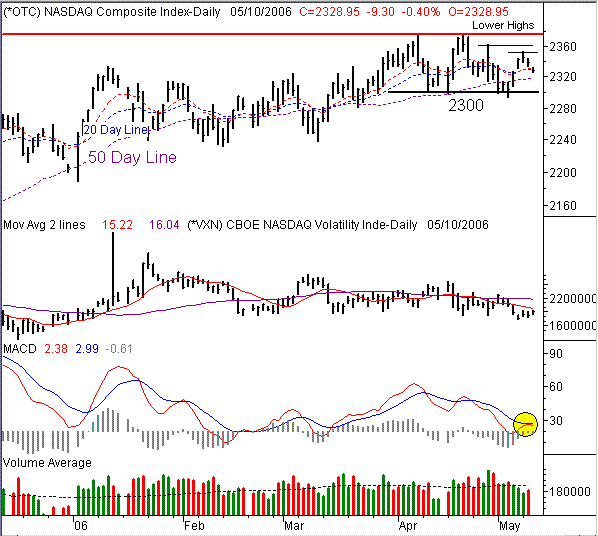
The NASDAQ Composite really hasn't followed through on last week's bullishness. Instead, the index has slipped into the red, by 10.36 points (-0.44%) for the day, and 14.68 points (-0.63%) for the week. However, that change in complexion is nothing new; we've seen that ebb and flow all year long, with the NASDAQ only being able to make tiny moves within a very narrow range. As it stands now, the composite looks like it's headed back to the lower edge of that range, but there is one thing worth noting that has a slightly bigger-picture bearish connotation.
First and foremost, the NASDAQ is back under the 10 and 20 day lines, assuming it closes near the current trading level of 2328.95. The 10 and 20 day lines are at 2330 and 2331, so there's still a chance at a semi-bullish close. Just don't count on it. You'll also want to note that yesterday's selling volume easily topped the bullish volume from Monday, qualifying it as a 'distribution' day. The final bearish aspect of our COMP chart is just the basically that the bigger trend is actually a bearish one. Over the last two weeks, we've made lower highs as well as lower lows. That fact has been a little obscured by all the back-and-forth churning, but in taking a step back, it's fairly clear that this index is struggling. Hence, the MACD lines are starting to redefine their prior bearish divergence. Oh yeah, the VXN is coming up off of multi-moth lows too. That's just a lot of things weighing in on the composite.
Anything bullish? Only a little. There is the possibility that today's dip was only intended to close the bullish gap from last Friday's open and last Thursday's close. If that was the case, then the deed is done, and the bulls can go about their business. That doesn't seem like its' the case though....not yet anyway.
In the meantime, support is still at 2300, with resistance at 2375. We're going to stick with our stance that the NASDAQ is content to be range-bound (and should be traded accordingly) until one of those lines is broken. We'll also repeat that the overall scenario still favors a bearish break rather than a bullish one. What factors? The calendar, the painfully low VXN, the lack of buying interest, and the sheer lack of leadership from the NASDAQ.
NASDAQ Chart

S&P 500 Commentary
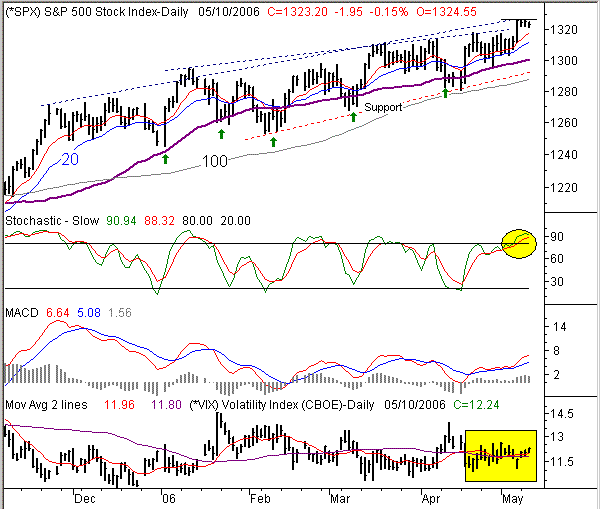
After the S&P 500 hit new multi-year highs on Friday, wide-eyed investors were thinking "this could be the big one." After all, it was a decisively bullish day, and you're supposed to buy into strength, right? Maybe, but it sure is odd that we've basically been stuck at or under that new high since then. The SPX actually 1326.55 that day, and has been as high as 1326.70 this week. But for our purposes, that's essentially the same ceiling, especially given that there isn't enough juice to even challenge that resistance line.
In fact, it seems the S&P 500 is fading again. For the day we're down 1.95 points (-0.15%), and for the week we're in the red by 2.55 points (-0.19%). That's certainly not catastrophic, but it's sure not the kind of environment we were in late last week.
Like the NASDAQ, the S&P 500 has a lot of things working against it. We already mentioned the resistance just under 1327, but there's also the fact that we're very stochastically overbought. In recent months, overbought situations were quickly corrected, so we have to assume that something similar will happen this time. Also note that the VIX is on the rise again, having crossed back above the 10 and 50 day averages this week after a strong reversal bar was made on Friday (despite the huge bullish surge). So even though the momentum still looks mostly bullish, we're still looking for at least a mild correction to burn off some of this bizarre confidence (VIX) and over-extension (stochastics).
A dip back to the intermediate-term support line (red, dashed) is realistic. It's at 1292, sandwiched between the 50 day line and the 100 day line. However, it's rising a little every day, so adjust that mark accordingly. On the flipside, a break above 1327 might force the buyers to throw caution to the wind and jump on board. If that happens, the concerns and worries may become irrelevant as the buying euphoria takes hold. That's the less likely scenario though.
S&P 500 Chart

Price Headley is the founder and chief analyst of BigTrends.com.