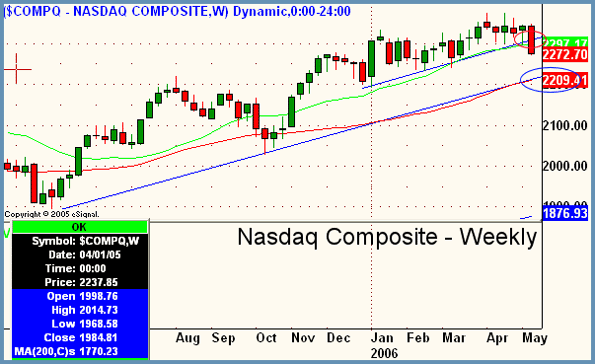
Good Morning, Traders. Very large selloff on Thursday left the Dow lighter by 142 (on the highest volume day on the NYSE of all of 2006!), the S&P worse off by 17, and the Nasdaq Composite diminished by a whopping 48. This last figure is especially telling because it only confirms what the I have been talking about rather non-stop for weeks now. That being whenever sellers take the upper hand in this market they hit tech stocks much harder than they do listed ones. The 48.05 point loss in the tech-heavy index represents a 2.07% drop as opposed to the other two major averages which only lost 1.25% on average. If that's not enough proof for you, consider market internals for a moment. Breadth on the NYSE was 2.54 to 1 negative, while on the Nasdaq it closed 7.6 to 1 (!) negative. Advancers lost to decliners by an almost equal measure, with around 1900 more losers than winners on both exchanges. Obviously with all this selling, the technical picture in the Nasdaq is not looking so hot right now. In yesterday's commentary we discussed an imminent breakdown in the $SOX, which would probably lead the Nasdaq lower. This came true right as rain and now we are left with the Composite chart below and its broken uptrend. The lower circled area at 50ma daily support (red) at 2209 area is more than likely where the Nasdaq is headed in the near term. I continue to favor listed issues (energy & metals especially) and sees tech as currently weak across the board.

Peter Reznicek is the Chief Equity Strategist and a principal of the Prana Fund, a domestic hedge fund, and ShadowTrader, a subsidiary of thinkorswim which provides coaching and education to its clients on both intraday and swing trading of equities. For a free trial to the full version of The Big Picture or to learn about ShadowTrader's other services, visit shadowtrader.net or send an email to preznicek@shadowtrader.net.