Yesterday was a great day to be short the stock indices and long some of the industrial commodities, especially crude, gasoline, gold and copper. As we noted previously the opacity of the FOMC announcement left traders perplexed on Wednesday but in yesterday's trading the underlying concerns about inflation, exacerbated by the continuing allocation switches into the metals, mining and energy sector, led to one of the most coherent downward trend days that has been seen for a long time.
Overall volume was the highest for the year and the Nasdaq and Russell 2000 were the biggest casualties on the session. We have included the chart for the Nasdaq 100 and decided not to draw any trendline as there are so many ways to interpret where we may go from here. We may be setting up for a powerful short squeeze which would not be too surprising, but if there is no respite in the rampant commodity sector and the dollar comes under further pressure we may be on the verge of a major shift in sentiment.

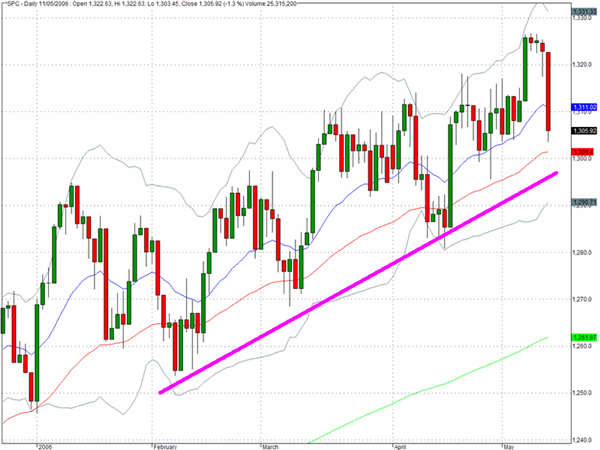
The S&P 500 dropped 1.3% and as the chart makes clear we are back below the 1310 resistance level and approaching the trendline through the 2006 lows. The 1280 level which has proven critical support for several weeks will probably be targeted next and it is important for the overall market that this level holds.
The Russell 2000 (^RUT) declined by 2.4% in yesterday√Ę‚,¨‚"Ęs sell-off and has reverted to its 50 day EMA. As we have previously commented this is the point at which instigating a long IWM/short SPY trade would have worked out successfully over the last couple of years. But we may be approaching the nadir for the small cap stocks and would wait a little longer before deciding on the advisability of such an index spread.

The semiconductor sector as represented by SMH was not one of the biggest casualties yesterday but the action over the last four sessions has brought the sector proxy down below all of its moving averages including the 200 day EMA.

TRADE OPPORTUNITIES/SETUPS FOR FRIDAY MAY 12, 2006
The patterns identified below should be considered as indicative of eventual price direction in forthcoming trading sessions. None of these setups should be seen as specifically opportune for the current trading session.
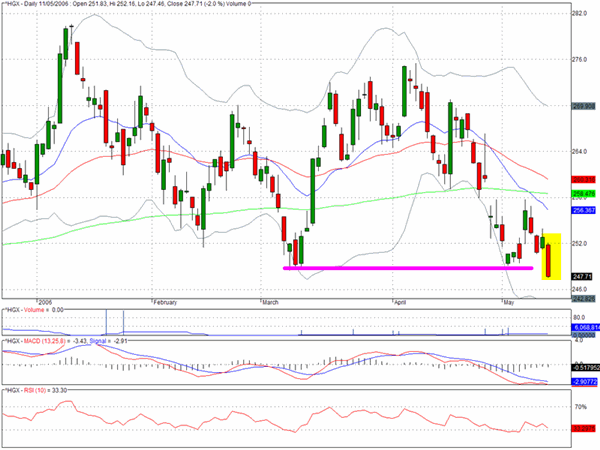
We discussed the chart for the housing sector (^HGX) yesterday and noted that it had reached a point where it would either rally or succumb to further selling pressure. The situation looks een more precarious after yesterday's trading and many of the homebuilders had a tough session yesterday.
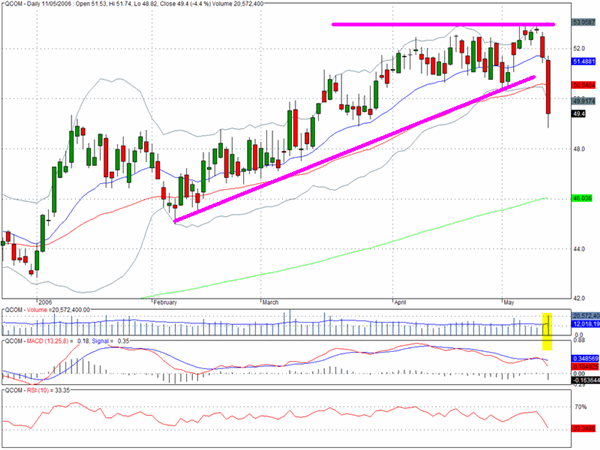
QCOM has one of the more revealing charts that shows why the big Nasdaq stocks are in trouble. The $52 level proved to be strong resistance as we anticipated last week and the sell-off brought a fairly serious looking red candlestick on the chart. We would expect to see some buying interest developing in stocks such as QCOM if the Nasdaq 100 is going to pull out of its nosedive.
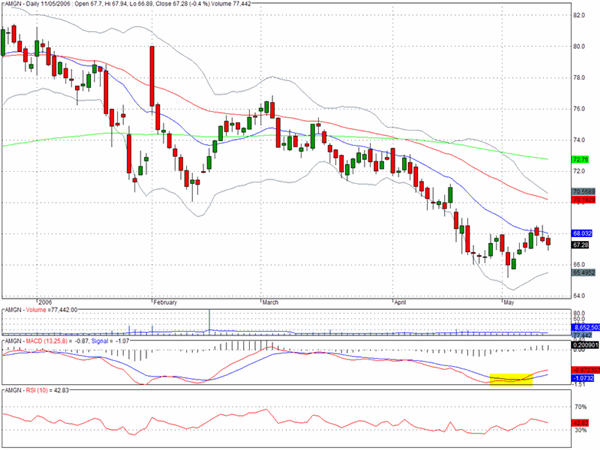
A contrarian play that appeals to us following yesterday's action is to look at the biotech stocks that have acted poorly for some time but may be sold out and perhaps will be the beneficiaries of some sector rotation strategies. Amgen could be attractive on the long side and the chart for Genentech looks more constructive than the one we just reviewed for QCOM.
One of our recent short recommendations, Foundry Networks (FDRY) delivered yesterday from its bearish pullback channel formation.

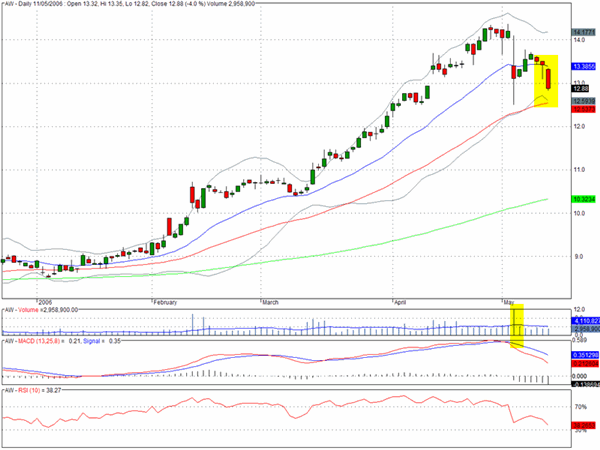
Another recent short recommendation Allied Waste (AW) has returned more than 5% since we discussed it and while it may try to recover from yesterday's drop, if it was to fall below the 50 day EMA it could have a lot more downside potential.
Clive Corcoran is the publisher of TradeWithForm.com, which provides daily analysis and commentary on the US stock market. He specializes in market neutral investing and and is currently working on a book about the benefits of trading with long/short strategies, which is scheduled for publication later this year.
Disclaimer
The purpose of this article is to offer you the chance to review the trading methodology, risk reduction strategies and portfolio construction techniques described at tradewithform.com. There is no guarantee that the trading strategies advocated will be profitable. Moreover, there is a risk that following these strategies will lead to loss of capital. Past results are no guarante of future results. Trading stocks and CFD's can yield large rewards, but also has large potential risks. Trading with leverage can be especially risky. You should be fully aware of the risks of trading in the capital markets. You are strongly advised not to trade with capital you cannot afford to lose. This article is neither a solicitation nor an offer to buy or sell securities.