Yesterday we got a question about the stochastics tool. Specifically, the reader asked what the %K line and the %D were (besides the key lines we watch when using stochastics lines). We've always felt that you should at least understand the basics of a technical analysis indicator if you're going to use it, so today, we'll get detailed with the ins and outs of stochastics.
First and foremost, understand that stochastics is an oscillator. That just means that the range of the tool is fixed, usually between 0 and 100, but sometimes between 0 and 1.0. The data point, such as he %K and %D lines, 'oscillate' within that range. Whenever this data approaches the extreme ends of the range (near 100 or near 0), then the market or the stock in question is considered to be oversold or overbought. Of course, you know what's supposed to happen when stocks are oversold or overbought, right? It means a reversal is in the works. Of course it doesn't always work out that well, but more often than not, oscillators can spot the times when things are ripe for a reversal.
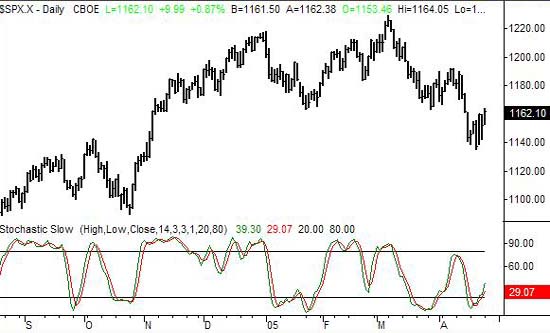
As always, a picture is worth a thousand words, so let's start out with a graph of the S&P 500 index with its stochastic lines plotted underneath. The green line is the %K line, while the red line is the %D line. The two black horizontal lines are plotted at 20 and 80. When the %K line falls under 20, then the market is 'oversold'. And when the %K lines is above 80, then the market is oversold. Even with only a quick glance, you can see how this oscillator at least has some success at spotting trend reversals.
S&P 500 with stochastics - Daily

OK, so we know that stochastics works, but what exactly are we looking at?
In simplest terms, the %K line shows where the current price of the index is in relation to the recent range of the index. The assumption is that gradual, evenly paced moves are sustainable. If there are no big rallies, then there won't be any profit-taking pressures to send stocks lower again (and vice-versa). So, as long as the current price isn't significantly above or below the recent high or low, then things are going smoothly, and a significant reversal is unlikely. On the other hand, when the index is pressing into new highs or new lows, that's when you start to see big swings in the other direction.
The formula for the % K line will help cement the concept in:
%K = 100 x (close - low over last 'n' periods)
(high over last 'n' periods - low over last 'n' periods)
where n = the number of periods under consideration
You can see the numerator calculates where the index is 'now' in relation to where its been, and the denominator establishes what should be a reasonable 'range' for the index based on the span of its recent trades. The 'n' can be any timeframe you want, but 14 periods seems to be the most common calculation. If the 'close' was near (or even at) the low for the n periods, then the numerator would be close to zero........and the %K stochastic line would be well into the 'oversold' territory, or under 20. But think about that for a second - for the %K line to be that low over that time frame, it would have to be because of a pretty strong dip in a relatively short period of time. And as we all know, that's when stocks are highly prone to strong rebound.
The %D line is pretty simple....it's just a moving average of the %K line. It smooths out the %K data, which can be pretty erratic. Unfortunately, it also lags the %K line, making it a slower indicator. As with most indicators, you have to choose whether or not that downside of the %D line makes the upside worth using. You'll usually find both the %K line and the %D line plotted on the same chart, but you really only need one of them to use the stochastic tool.
So that's it; it's actually a pretty simple calculation. The real trick is figuring out how to overcome the problem you've hopefully seen by now. As we saw in November, it's more than possible for the market to stay overbought for a long period of time - so much for the reversal theory. That's why we use stochastics a little bit differently. Our signal is a cross of the %K and %D lines back below 80 or back above 20. That's a sign of two things. First, it means that the index was oversold (or overbought) and ready for a reversal. And second, it means that the market is finally coming out of the condition, by heading back the other way.
Be sure to keep stochastics in your arsenal, but keep in mind that there are several interpretations of it. It's best used with a small group of other tools, including at least one momentum indicator.
Price Headley is the founder and chief analyst of BigTrends.com.