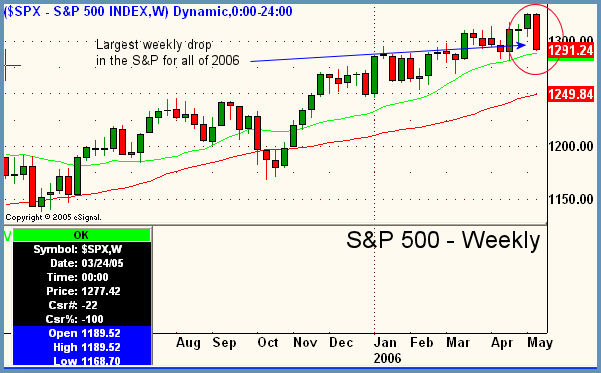
Good Morning, Traders. Two days of heavy selling in the broad market have left our S&P 500 chart somewhat damaged at this point. Lately we've been harping on the fact that the Nasdaq, for the most part, changed trend some time ago and has been steadily showing signs of relative weakness while the Dow and S&P continued to power higher. As of this week's close, this may not be the case anymore. Within two trading days after the fed announcement on Wednesday, the Dow lost 261.66 points while the S&P shed 31.61. In earlier commentaries, I have been saying that the Dow has strong odds of testing the all-time highs very soon at 11750. After these two bloody (referring to the amount of selling, not the British derogative) days, I now change my stance officially to say that it may take longer than expected! The chart below of the S&P is a weekly. The current week that just ended is circled in red, and is quite obviously the strongest week of selling we have had all year. Like Thursday, overall volume was strong (signs of institutional distribution), and breadth and advance decline figures continued to come in overly negative. It's relatively rare to get decliners beating advancers on either exchange by more than 1500, but that figure was breached on both the NYSE and Nasdaq yesterday. Even more important than the numbers on market averages and internal indicators quoted above is the fact that from our own perspective in scanning the markets for Focus List plays, we are starting to see many patterns which were previously strong starting to show signs of cracking or completely falling apart. Breakouts from sound bases are beginning to fail more often, and metals stocks which have been the lynchpin of this bull run are starting to show signs of tiredness and could correct sharply from these levels. I advocate doing a whole lot of nothing at this juncture and waiting for gold to correct to about 600 per oz. for a long-term entry. If the broad market begins to fall apart in earnest, that will be the only move, really.
Be sure to check for earnings announcements before entering new positions over the next few weeks.

Focus List

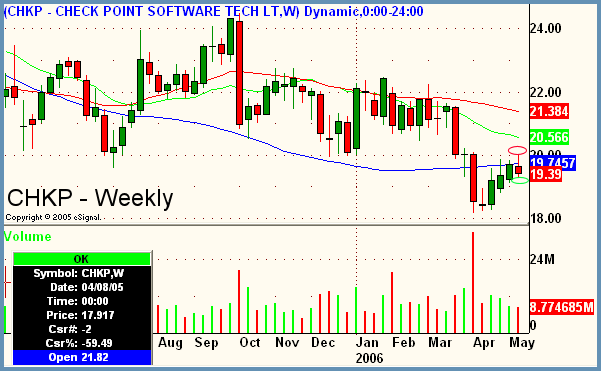
CHKP - Checkpoint Systems
Industry - Software
Side - Short
Trigger - 19.18
Stop - 20.10
Target - 18.00-
Timeframe - multiweek
Notes
- Major support at 20 has been broken and now stock has rallied to this same area and stalled
- 200ma (blue) also breached to downside and is resisting above now as well
- Software sector suffered a major concussion in last week's trade

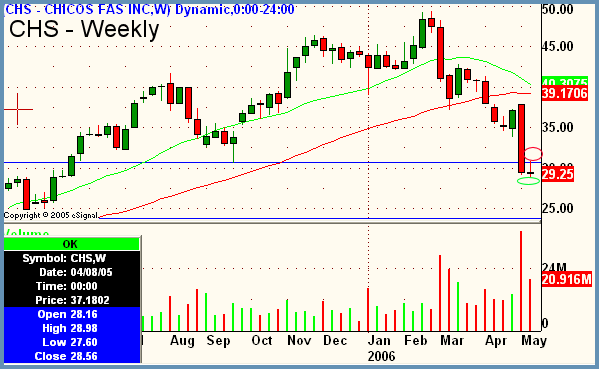
CHS - Chico's FAS Incorporated
Industry - Specialty Retail
Side - Short
Trigger - 28.77
Stop - 30.93
Target - 25.00
Timeframe - 2 weeks to one month
Notes
- Break of support level from September '05 resulting in small body inverted weekly hammer
- Entry/stop is under/over this small weekly bar
- Small weekly bar is following a very large expansion of range to the downside which indicates a pause before continuation of recent trend
Peter Reznicek is the Chief Equity Strategist and a principal of the Prana Fund, a domestic hedge fund, and ShadowTrader, a subsidiary of thinkorswim which provides coaching and education to its clients on both intraday and swing trading of equities. For a free trial to the full version of The Big Picture or to learn about ShadowTrader's other services, visit shadowtrader.net or send an email to preznicek@shadowtrader.net.