NASDAQ Commentary
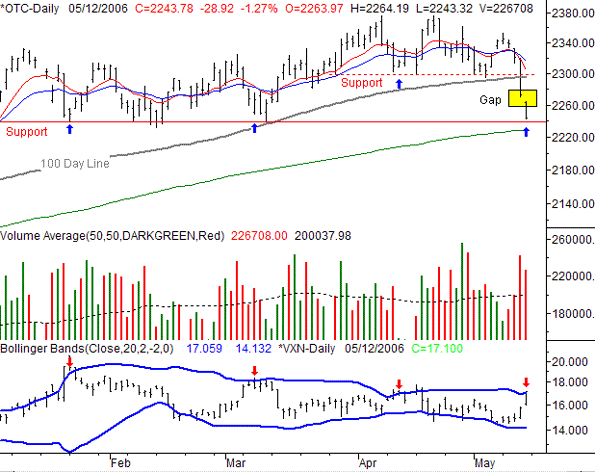
In the MidWeek Update we cautioned that things looked more like a setup for the bears than any beginning of a monster rally, primarily because the NASDAQ was lagging (badly). On Thursday and Friday, that's pretty much how it panned out. For the week, the NASDAQ Composite fell 98.79 points (-4.22%) to close at 2243.78. That's the second lowest close all year long, and certainly should be a concern for the bulls. Yet, there may be a small glimmer of hope if you didn't get to make exits before the destruction in the latter part of last week. Could that short-term bullishness turn into longer-term bullishness? Anything's possible, but we'd have to say the odds are against it.
OK, the coming few days are going to be tricky to navigate. Not only are we in the wake of an extreme selloff (which encourages some buying from the bottom feeders), but we're also entering an option expiration week, which wreaks its own special brand of havoc. There is no guarantee, but here's what we see in store.
Basically, the sellers went a little overboard. Yes, we were due for a dip, as we stated last week. However, a 4.2% selloff is a little much - too much, maybe. Going from the overbought extreme to the oversold extreme is now setting up an upside bounce, at least to a small degree. We saw a bearish gap between Thursday and Friday, which should be pressured to get filled in the coming week - possibly early in the coming week. You'll also see that the VXN is back at its upper Bollinger band (20 day), which is usually when the rebound starts. See the arrows on the VXN and NASDAQ charts? Take a look at the last three times the VXN bumped into its upper band - three bounces. The only caveat is that the VXN may end up making a series of higher closes, ALL above the upper band. If the VXN actually starts to trend higher rather than meet resistance at the upper band line, then forget about the bounce - the buyers aren't quite ready yet.
In either case, our 'bigger-picture' outlook is generally bearish, whether we get that short upside move or not. The composite is under the 100 day line for the first time in months. Plus, we've seen that 'higher highs' trend turn into 'lower lows' since late April. The tone is definitely changing, and the NASDAQ is leading the way. If we get that bounce, we're going to expect resistance around the 100 day line (2299). If the composite starts to roll over around there, that would probably be a good entry point for new short/bearish trades.
NASDAQ Chart 
S&P 500 Commentary
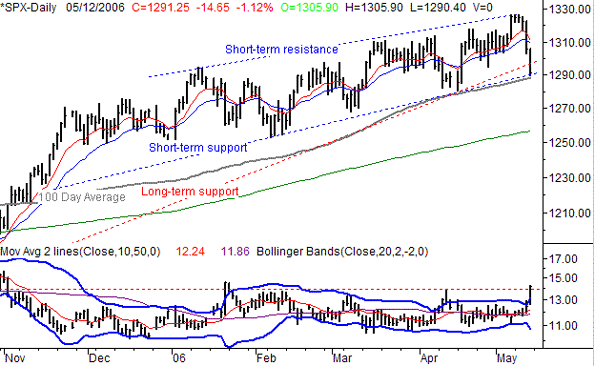
The S&P 500's close at 1291.25 last week was 34.50 points lower (-2.6%) than the prior week's close, with most of that loss being incurred on Thursday and Friday. While we generally try and take things at face value, here, we have to look at the bigger picture. Based on the pattern we've seen all year long, the selloff for the SPX might actually be close to an end. If it's not, then this short-term breakdown is about to turn into a much bigger bearish move.
A few days ago we commented that the S&P 500 had been range-bound in a channel that was generally bullish, and that the pressures of being overbought were probably going to be just strong enough to drive the index to the lower edge of that range. Well, even after last week's plunge, the SPX is just now at that lower support line. Check out the short-term channel lines (blue, dashed). It's definitely pushing its limits now, but technically, the support is intact. The same goes for the support provided by the 100 day moving average. Until it breaks, we want to give the benefit of the doubt to the bulls. Besides, the VIX is also at an extreme that suggest a short-term bottom. So, don't be shocked if we see some strong buying early in the coming week.
The question is, how much? Will the bigger uptrend resume, making this dip just one of many in a zig-zag motion? Maybe, but look at the long-term support line (red, dashed). It extends all the way back to October, so clearly the momentum is waning.
The ultimate test is the 100 day moving average line, currently at 1288. It's going to be tested as support real soon (Friday's low was 1290.40), much like it was tested in early April. If that line breaks - and it wouldn't have to be immediately - then we'll look for a trip possibly all the way back to the 200 day line at 1257. But we'll repeat, it doesn't have to happen immediately. With as mush selling as we went through over the last two days, a bounce of some sort is very possible. The SPX could crawl all the way back to the 10 or 20 day average line (1313) before rolling over again and moving under 1288. Keep your eyes open in the coming week - it's going to be interesting.
S&P 500 Chart 
Dow Jones Industrial Average Commentary
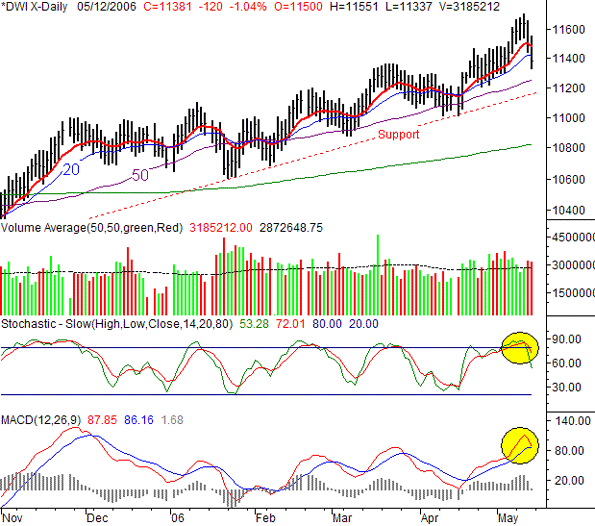
Despite the fact that the Dow has been leading the bullish charge over the last few weeks, even its relative strength wasn't enough to keep it out of the red by the time Friday's closing bell rang. The blue-chip index closed at 11,381, losing 197 points (-1.7%) over the last five sessions. It was still the most resilient though, in that it lost the least - as we discussed a few weeks ago. Nevertheless, a loss is a loss, and there may be some more of them in store for this chart in the next few days.
Basically, the Dow's incredible strength over the last month left it a little more vulnerable to a correction. So, the blue-chip index isn't quite as primed for a bounce as the other indices are. In fact, if anything, the Dow is still poised to fall a little further - to the long-term support line around 11,155.
Other than that, the bigger-picture scenario for the Dow is about the same as for the other two indices.
Dow Jones Industrial Average Chart 
Price Headley is the founder and chief analyst of BigTrends.com.