Is it too soon to be writing the obituary for the three year bull market that has seen the S&P 500 come back from the 800 level in mid-March 2003 to 1300 plus within the very recent past? The DJIA almost broke out to an all-time high only a week ago and, as has been seen so many times over the last year, just when the market has suffered from severe downward thrusts it rallies back strongly forcing shorts to cover and encouraging portfolio managers to extend their long exposure. But could it be different this time? Having raised expectations that we might be prepared to offer our opinion on this key question we hasten to add that we are not yet ready to be baited by the opportunity.
Our concerns are the weakness of the dollar, the fact that Treasury yields have moved beyond 5% and do not seem ready to stabilize, the fact that, once out of the bottle, the inflation genie is very hard to put back, and most central bankers are genuinely concerned about the consequences of several years of very easy monetary policy. We are seeing the consequences in the rampant demand for industrial commodities and the fact that in many economies the consumer has taken on historically high debt levels that could become dangerously difficult to service if interest rates continue their rise. The Fed has raised rates from 1% in 2002 to 5% and there should be serious doubts that the story could be as simple as that they are now close to done.
Frankly, we doubt whether they have any idea whether they are done and the external pressures such as exchange rates and commodity prices will only reveal their future course in coming months.
Moderating our concern is the fact that markets rarely send out clear signals when they are about to fundamentally change direction. We suspect that many hedge funds have piled into the hot commodity sectors and are betting against the equity indices and the dollar as well. This seems to be an unlikely recipe for a meltdown but the cross currents of ominous looking price movements in critical economic sectors could unsettle enough fund managers with long only strategies that we may see a protracted correction.
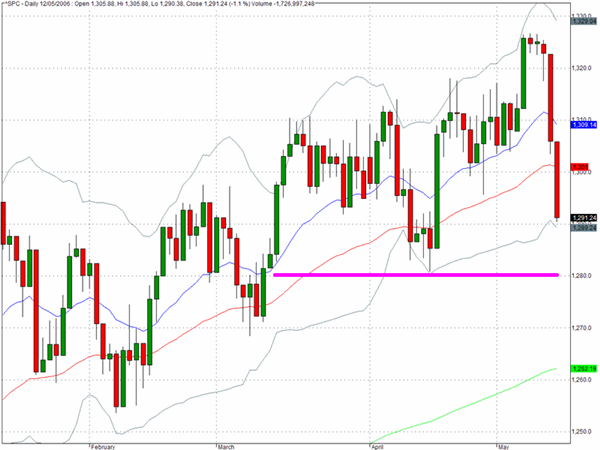
Reviewing the chart for the S&P 500 we suspect that the 1280 level will need to be tested again and once we see how that test goes we may be in a better position to know how serious the correction may become.
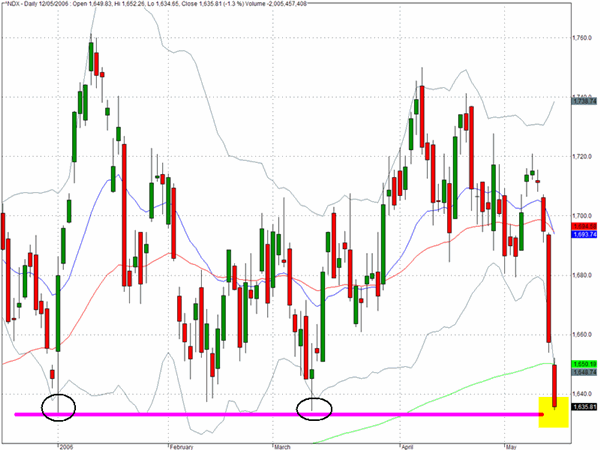
Meanwhile the Nasdaq 100 (^NDX) is poised at a critical point as the chart below shows. This will be the third test of the 2006 lows and we would not be surprised to see a violation of this level as there is clearly a lack of enthusiasm for the big tech names.
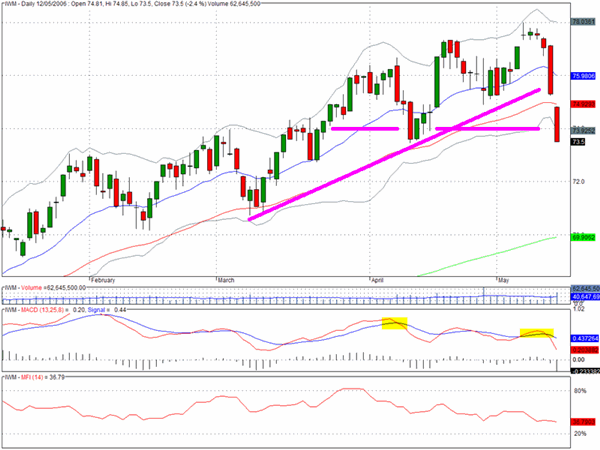
The Russell 2000 cash index (^RUT) declined by 2% on Friday and that followed on from the 2.4% drop in Thursday√Ę‚,¨‚"Ęs ugly session. We have included the chart for the IWM proxy and as can be seen this index declined by a larger amount on Friday than its underlying cash index.
If we have seen a significant intermediate peak in the relative outperformance for the small cap stocks this would also point toward an important shift in sentiment. The leadership has come from the small cap stocks during the last three years, and if that is now ebbing, and if the technology sector remains out of favour it becomes a matter of concern as to where the leadership will come from to sustain future upward momentum.
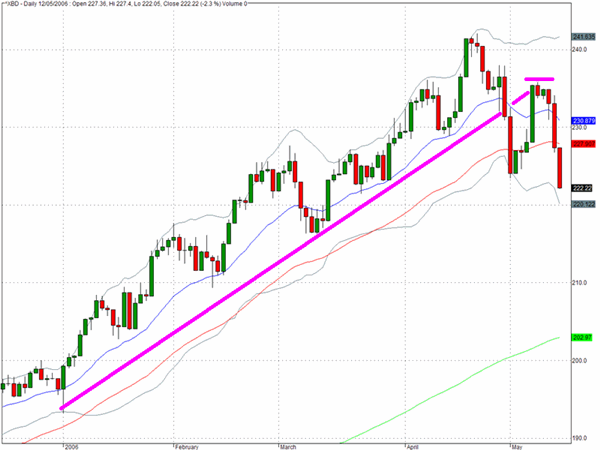
One other sector that has revealed a definite transition recently is the broker/dealer sector (^XBD). It may be worth reflecting on the fact that the major investment bankers not only carry large inventories of Treasuries but are also often closest to the arcane practices of the major institutional asset managers and their asset allocation models.
TRADE OPPORTUNITIES/SETUPS FOR MONDAY MAY 15, 2006
The patterns identified below should be considered as indicative of eventual price direction in forthcoming trading sessions. None of these setups should be seen as specifically opportune for the current trading session.
We have recently featured QCOM as having one of the more revealing charts that shows why the big Nasdaq stocks are in trouble. The stock has now approached an area of chart support and it will be instructive to see whether this will attract some buying interest.

We will repeat the point that we made on Friday about a possible contrarian strategy that could be appealing given the current market environment. The biotech stocks have acted poorly for some time but may be sold out and perhaps will be the beneficiaries of some sector rotation strategies. Amgen (AMGN) that we mentioned on Friday managed to make some progress in what was obviously a difficult day for most of the other Nasdaq big names.

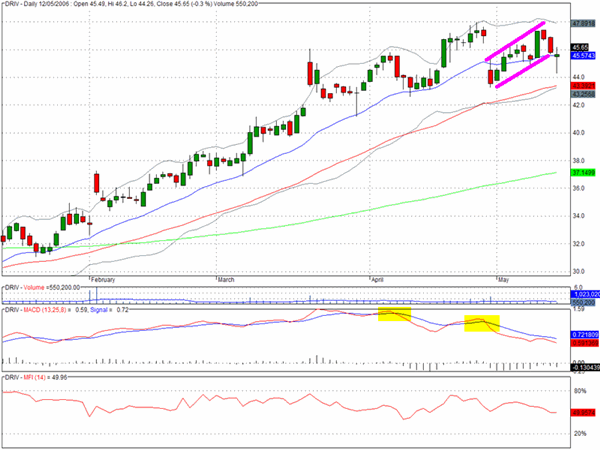
Digital River (DRIV) continues to look vulnerable to us and there are some strong negative divergences.
Clive Corcoran is the publisher of TradeWithForm.com, which provides daily analysis and commentary on the US stock market. He specializes in market neutral investing and and is currently working on a book about the benefits of trading with long/short strategies, which is scheduled for publication later this year.
Disclaimer
The purpose of this article is to offer you the chance to review the trading methodology, risk reduction strategies and portfolio construction techniques described at tradewithform.com. There is no guarantee that the trading strategies advocated will be profitable. Moreover, there is a risk that following these strategies will lead to loss of capital. Past results are no guarante of future results. Trading stocks and CFD's can yield large rewards, but also has large potential risks. Trading with leverage can be especially risky. You should be fully aware of the risks of trading in the capital markets. You are strongly advised not to trade with capital you cannot afford to lose. This article is neither a solicitation nor an offer to buy or sell securities.