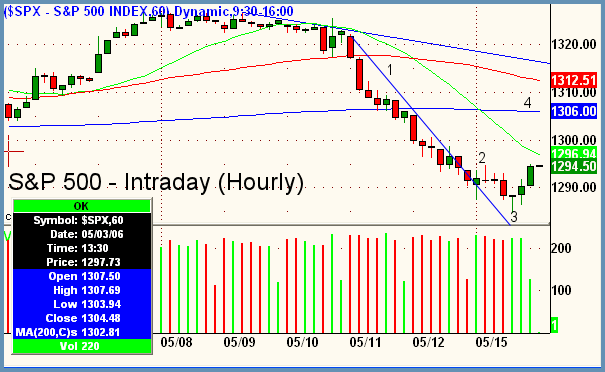
Good Morning, Traders. Many signs yesterday that we have put in a near-term bottom. When we say near term, we mean that the odds of a small bounce are decent here. How far that bounce goes, we are not saying as neither we nor anyone can truly know. Let's analyze the intraday chart of the S&P below to see the various technical factors that may be signaling at least a short-term respite from the selling. The first thing to note is that although it's not visible on the chart below, Monday's choppy action closed right at the support of the 20ma weekly. Secondly, one need to only glance at the closing figures on the three major averages to note that for the first time in four days at least two of the three closed green. The Dow, being the strongest as of late, actually managed to salvage 47 of its recently lost points. Moving to the chart below, let's look deeper and into some technical factors that are coming into play as well. The blue line labeled number 1 is the defining trendline, which began at May 11. On the 12th, we had a false reversal (2) over the trendline, which went lower yesterday and then culminated in the strong bullish hourly hammer at point 3. Now, let's go back to the false reversal at point 2. Notice that the late day rally yesterday pushed prices right back to this prior intraday peak where sellers again took over. If this point is taken out today to the upside, then it would logically follow that bears will realize that the bottom at point 3 was real and that covering should ensue. If so, I would say we could expect a retracement to about the 1306 area. The reasons for this are two-fold. Firstly, it's approximately 50% of the move down. Secondly, the blue line cutting across at point 4 is the 200ma, which tends to act as a magnet for prices. There are also prior lows from late April and early May in this area which will resist on a bounce. Given our assessment above, we offer a few reversal plays to the long side, keeping firmly in mind that nothing in the markets is foolproof or guaranteed. As professional traders we can only assess the situation with the least amount of emotion possible and decide at what pivot point would the greatest amount of sellers or buyers be wrong and then trade in that direction.
Focus List
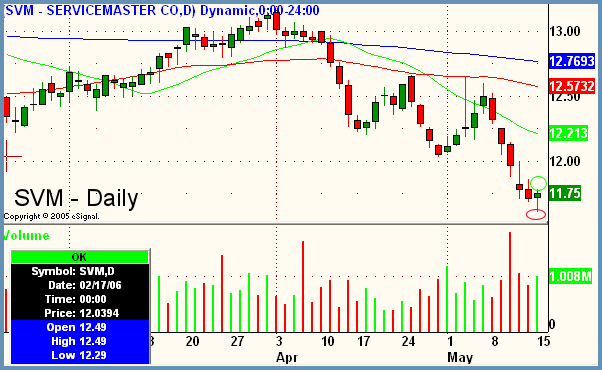
SVM - Service Master Company
Industry - Services
Side - Long
Trigger - 11.83
Stop - 11.55
Target - 12.10-12.20
Timeframe - 2-3 days
Notes
- Short-term reversal play, "right or right out"; respect parameters and cut losses quickly and take gains when you have them.
- Reversal plays are often 1:1 risk/reward.
- Sell off to support of 200ma weekly (not shown).
- Target is to downtrend above or at 20ma daily (green).
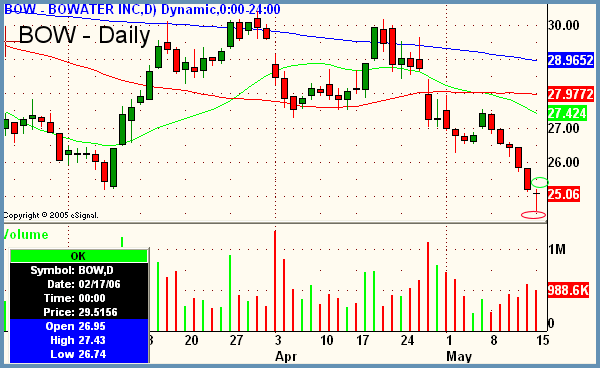
BOW - Bowater, Incorporated
Industry - Materials (Paper)
Side - Long
Trigger - 25.25
Stop - 24.50
Target - 26.00
Timeframe - 2-3 days
Notes
- Short-term reversal play, "right or right out"; respect parameters and cut losses quickly and take gains when you have them.
- Reversal plays are often 1:1 risk/reward.
- Major support on weeklies (not shown) at this level.
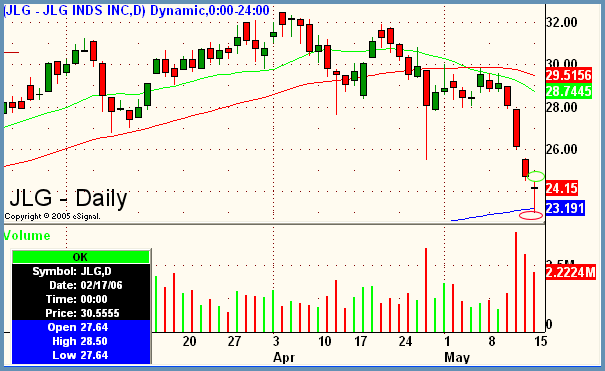
JLG - Bowater, Incorporated
Industry - Machinery (Farm & Construction)
Side - Long
Trigger - 24.55
Stop - 22.95
Target - 26.00
Timeframe - 2-3 days
Notes
- Short-term reversal play, "right or right out"; respect parameters and cut losses quickly and take gains when you have them.
- Reversal plays are often 1:1 risk/reward.
- 200ma daily (blue) support at low of reversal hammer.
Peter Reznicek is the Chief Equity Strategist and a principal of the Prana Fund, a domestic hedge fund, and ShadowTrader, a subsidiary of thinkorswim which provides coaching and education to its clients on both intraday and swing trading of equities. For a free trial to the full version of The Big Picture or to learn about ShadowTrader's other services, visit shadowtrader.net or send an email to preznicek@shadowtrader.net.


 Free Festival of Traders Videos