In our daily scanning, we noticed a very large number of stocks that registered hammer candlesticks yesterday and the same pattern is to be found on many of the index charts. The S&P 500 continued to probe the downside and on its low for the day at 1284 it appears to have found support enabling it to close ten points higher at 1294 for a small gain on the day. We may see some consolidation activities at current levels but we would also expect to see a more robust testing of the 1280 level in the near future.
In sector action the homebuilders and broker/dealers continued their slide and yesterday saw some fairly steep drops for many energy stocks and the industrial commodities sector. Our intuition about AMGN has proven to be correct as the stock has gained 4% in the last two sessions.

As we anticipated in our weekend commentary the Nasdaq 100 (^NDX) initially failed to acknowledge support at the previous 2006 lows and continued to probe lower levels. The 1620 level provided that support in yesterday's trading and as the long lower tail suggests there may be an attempt to consolidate near the previous 2006 lows at 1640.
Another way of interpreting yesterday's spike down was to set up a false breakdown and intermediate bearish exhaustion that may be now followed by a fairly abrupt reversal that may even have taken root in yesterday's trading. We would not see this as an opportunity to get long the big Nasdaq names but rather we would wait for an opportunity to look for short opportunities as the recovery effort runs out of steam.

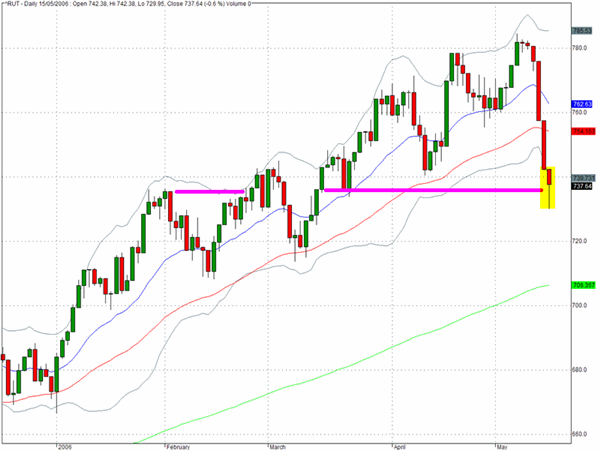
The Russell 2000 cash index (^RUT) declined by another 0.6% yesterday but is now poised at an area of chart support in the vicinity of 740 where it would not be surprising to see some buying interest emerge. The steepness of the drops over the last few sessions would make us cautious on the long side and we would be surprised to see a quick resumption of the previous pattern of small cap recovery leading the other indices higher.

The chart for the ETF for the basic materials sector, XLB, shows a rupture pattern in which the gap down sell-off from April 27th on heavy volume produced the first fissure that suggested some corrective action could be in store. The sector then mounted a strong price recovery that established new price highs but this was not accompanied by confirming momentum and volume characteristics. Volume has picked up on the secondary breakdown and the Spinning Top candlestick sitting right at the 50 day EMA could possibly be the marker for the beginning of a bearish flag pattern as another recovery may be attempted.

TRADE OPPORTUNITIES/SETUPS FOR TUESDAY MAY 16, 2006
The patterns identified below should be considered as indicative of eventual price direction in forthcoming trading sessions. None of these setups should be seen as specifically opportune for the current trading session.
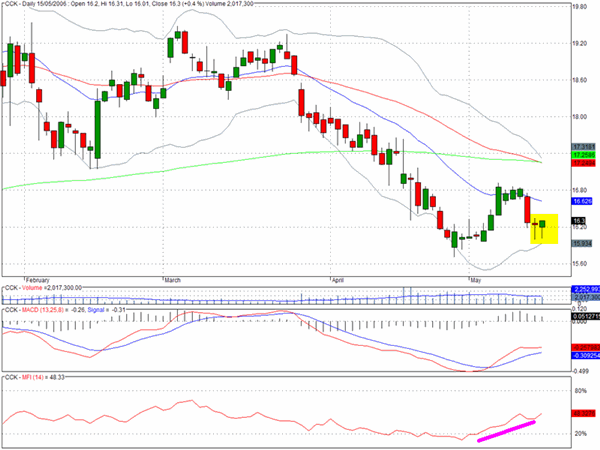
Crown Holdings (CCK) shows evidence of accumulation and could be headed to the intersection of the 50 and 200 day EMA's.

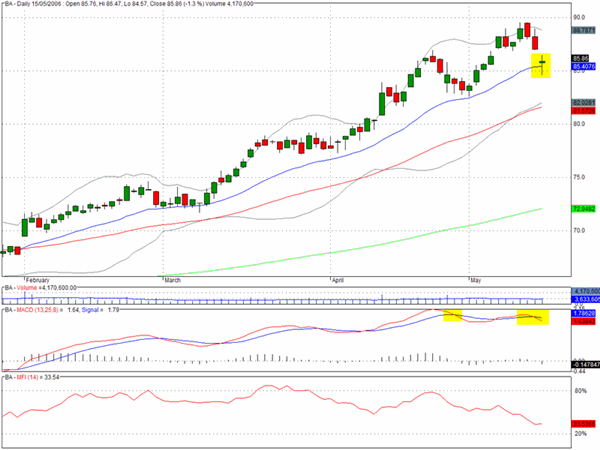
Boeing (BA) recorded a Doji fomation after gapping down on the open yesterday. There are notable momentum divergences and distribution appears to have been going on recently while the price was moving higher.

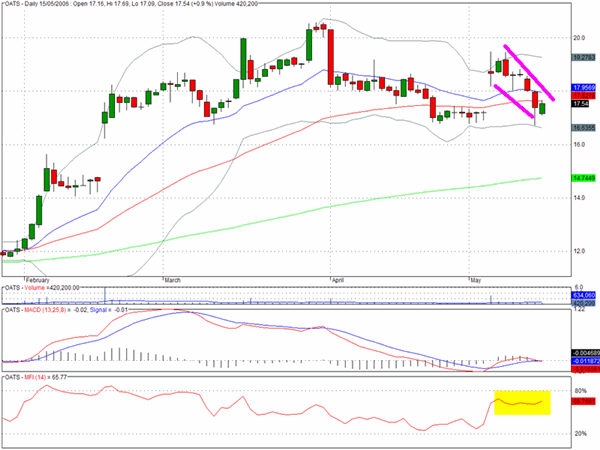
Wild Oats Markets (OATS) could be ready to try another attempt at breaking above $20.

Clive Corcoran is the publisher of TradeWithForm.com, which provides daily analysis and commentary on the US stock market. He specializes in market neutral investing and and is currently working on a book about the benefits of trading with long/short strategies, which is scheduled for publication later this year.
Disclaimer
The purpose of this article is to offer you the chance to review the trading methodology, risk reduction strategies and portfolio construction techniques described at tradewithform.com. There is no guarantee that the trading strategies advocated will be profitable. Moreover, there is a risk that following these strategies will lead to loss of capital. Past results are no guarante of future results. Trading stocks and CFD's can yield large rewards, but also has large potential risks. Trading with leverage can be especially risky. You should be fully aware of the risks of trading in the capital markets. You are strongly advised not to trade with capital you cannot afford to lose. This article is neither a solicitation nor an offer to buy or sell securities.