NASDAQ Commentary
Ouch! The NASDAQ Composite is down 19.16 points today (-0.86%), which brings the total loss for the week to a hefty 33.81 points (-1.51%). That's still nowhere near last week's losses, but then again, the week isn't over yet. In any case, the bear has a pretty firm grip now, taking things from 'bad' to 'worse' with today's round of selling. By that, we just mean a major long-term support line was breached.
You can scratch the support level of 2300 - it's no longer a factor....nor are the 10, 20, and 50 day moving averages. They're all anywhere from 60 to 100 points above the current level of 2209.97. But that's not even the immediate concern for the bulls. That move to 2210 today brings the composite under the critical 200-day average line for the first time since October. Needless to say, this should convince anyone that things are not bullish like they were just a few weeks ago (not that they were ever really that bullish for the NASDAQ).
We had discussed the possibility of a short bounce after least week's selling, based mostly on the fact that the CBOE Volatility Index (VXN) had shot up a little more than we might expect in a rather tame environment. So far, though, we haven't gotten it. The VXN eased a bit yesterday, but is pushing higher again today. So, The VXN 'spike' last Friday is looking les and less like a spike and more and more like the beginning of a bigger upward move. In simplest terms, that's bearish for stocks. That said, we still expect the bears to ease up a little bit and allow for a quick bounce - some of this downward pressure has to be bled off. Don't over-react to that....it may just be a dead-cat bounce. With the NASDAQ at new lows for the year, the bigger picture is a bearish one.
Interestingly, volume really hasn't changed that much. That can be taken two ways. The first interpretation is just that since the volume in this downtrend isn't growing, then the move is only temporary. The second interpretation - and ours - is that volume is stable, and that the selling (despite the major losses) is methodical and calculated. That eliminates the likelihood of any snap-back rallies where everybody rushes back into the market after a stampede out of it. Again, that's bearish for stocks.
NASDAQ Chart

S&P 500 Commentary
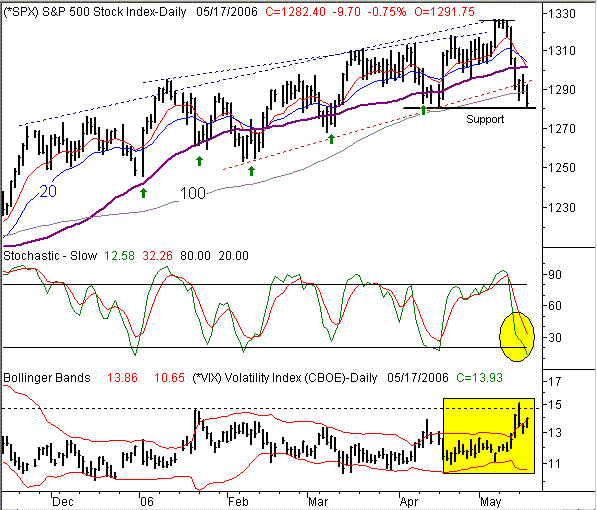
The S&P 500's 9.7 point dip (-0.75%) today brings the week's loss to only a total of 8.85 points (-0.69%), so the SPX is only in the red because of today's move to 1282.40. Yet, the bigger picture here is still a rather bearish scenario. Major support lines have been broken on this chart too.
The two key support lines breached here are the intermediate-term support line that extends all the way back to February (red, dashed), and the 100 day moving average (grey). The move under the 100 day line is the first time we've been there since October, so again, things are clearly different now.
What we haven't seen (yet) is a lower low for the year, but we're on the verge. Although the market has been on a see-saw for months, that back-and-forth movement has been more bullish than bearish. That's why Q1 was such a good one for the bulls. In fact, we have yet to actually make a lower significant (nor have we failed to make a lower significant high). That is....until now. The S&P 500 hit a low of 1280.75 in mid-April, and hit 1281.40 today. So, the support hasn't been broken yet. But clearly, it won't take much to break it. If we see a move under 1280.75, look for any remaining bullishness to crumble just a little more.
At the same time, we're not taking this support line lightly, especially given the current circumstances. We've been through a major wave of selling, and the SPX is now stochastically oversold. Even though the chart looks pretty bearish right now, there are always buyers somewhere. Plus, the VIX is reaching higher again. Overall, that's a recipe for a bounce. It shouldn't be a big one, but there's a respectable amount of pent-up bullishness we're facing now. As with the NASDAQ, don't get too excited when-and-if we get it....a lot of technical damage has already been done. If anything, we'd look for a rebound up to the combined 10/20/50 day lines at 1300. But, we'd also expect to find resistance there, and the bears should take over again.
Side note: Notice that the VIX is pushing back above the upper Acceleration Band after falling back from Monday's high of 15.13. This is a different look from the VIX, which had recently made a habit of hitting an upper extreme, then immediately pulling back. As long as the VIX continues to trend higher, look for stocks to suffer.
S&P 500 Chart

Dow Jones Industrial Average Commentary
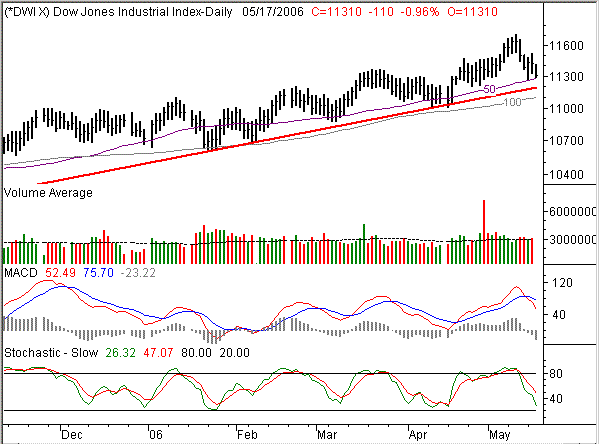
We mentioned that the Dow's recent unchecked runup left it the most vulnerable of all the indices, and that was verified today. For the day, the Dow is leading the charge lower by losing 110 points (-0.95%). For the week, the Dow is down 71 points (-0.62%), currently trading at 11,310. Yet, the Dow is also still holding up the best, but remaining above its 100 day line, and apparently finding support at its 50 day moving average line. Plus, its intermediate-term support line is still intact. So on a relative basis, this still seems like the safest place to be.
But from a bigger-picture view, seeing that MACD crossunder and a recent stochastic sell signal still leaves things in question.
With that mixed message, we'll give the benefit of the doubt to the blue-chip index until that 100 day line at 11,090 ir broken.
Dow Jones Industrial Average Chart

Price Headley is the founder and chief analyst of BigTrends.com.