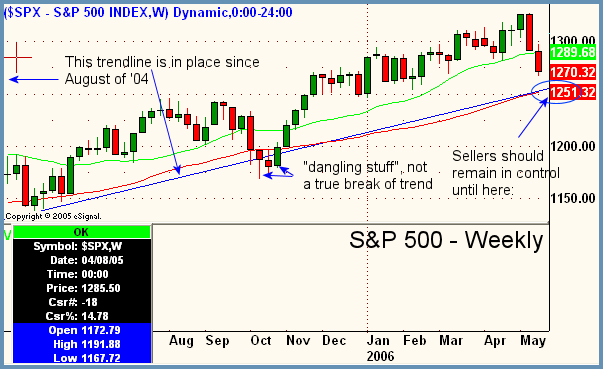
Good Morning, Traders. Bears out in full force on Wednesday after CPI and core CPI numbers signaled a bit of inflationary pressure on consumers. All major averages got the smackdown including a loss of 214.28 on the Dow, which was the second largest one-day point decline of the year. One of the main things to concern yourself when markets have big outside days like yesterday is what happened internally as the selling was going on. This is how you know whether or not things were really that negative or not. Unfortunately for the bulls, the pressure was heavy on Wednesday and according to our indicators, the selling was definitely real. Firstly, all sectors across the board got hit. Nothing on my Core Sector List managed to close green with miners ($GOX definitely pulling back now), Coal, and Broker Dealers feeling the worst of it. Even the "best" performing sectors on the list were off by more than a full percentage point from their respecive opens. Breadth was horrible at 9:1 negative on the NYSE and over 4:1 negative on the Nasdaq. For only the second time in 2006 and only the third time since October of 2005, did we have an advance decline line close on the NYSE worse than negative 2000. This is significant. It was significant in April when it happened earlier this year and it's significant now. The weekly chart of the S&P below shows us that we still have a way to go downward before any matter of support "catches" us. The weekly trendline support at 1250 is the next line of defense for the bulls and is 20 full S&P points below us. It makes sense technically that sellers will pause here as prior 2005 highs in this area, which were resistance before the breakout at the end of last year should support.

Peter Reznicek is the Chief Equity Strategist and a principal of the Prana Fund, a domestic hedge fund, and ShadowTrader, a subsidiary of thinkorswim which provides coaching and education to its clients on both intraday and swing trading of equities. For a free trial to the full version of The Big Picture or to learn about ShadowTrader's other services, visit shadowtrader.net or send an email to preznicek@shadowtrader.net.