Yesterday was the confirmation day that last week's selling needs to be taken seriously and removed the nagging doubts that we had over the weekend that, prior to what we saw yesterday, we could have been experiencing just another of the false breakdowns that would be followed by another abrupt bullish reversal.
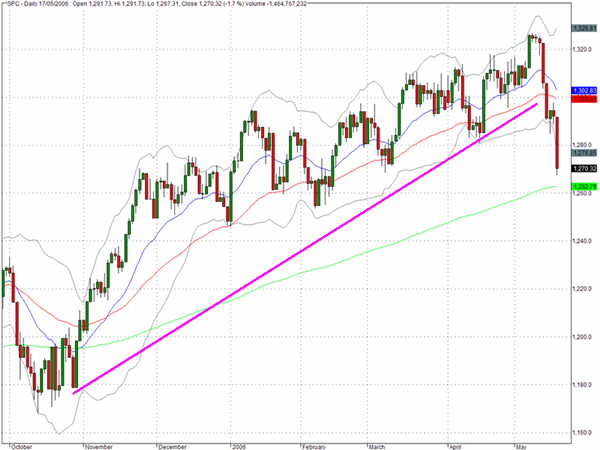
Some significant trendlines and support levels had been violated before yesterday but it is now clearly evident that a real correction has begun. The 1280 level on the S&P 500 not only failed to halt the decline, but there is now a very clear transition from the upward bias that has been in effect since last October.
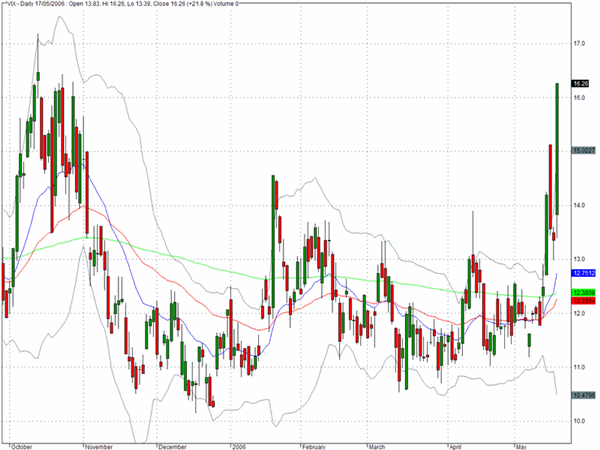
Fear was prevalent yesterday and the CBOE Volatility Index (^VIX) spiked back toward the levels of last October (more on this index later).The Dow Jones suffered one of the worst declines yesterday as it fell almost 2% which outpaced the declines of 1.5% for the Nasdaq Composite and Russell 2000. Just how long we will have to wait for another attempt at a new all time high for the DJIA is very unclear, but one thing is certain it is a lot less imminent that it appeared to be just ten days ago
Volume was more than twice the daily average on all of the exchange traded index proxies and the QQQQ registered more than 200 million shares. The broker/dealers continued to be amongst the worst casualties yesterday dropping almost 3% and we would suggest that this sector can act as a very useful leading indicator on overall market direction.
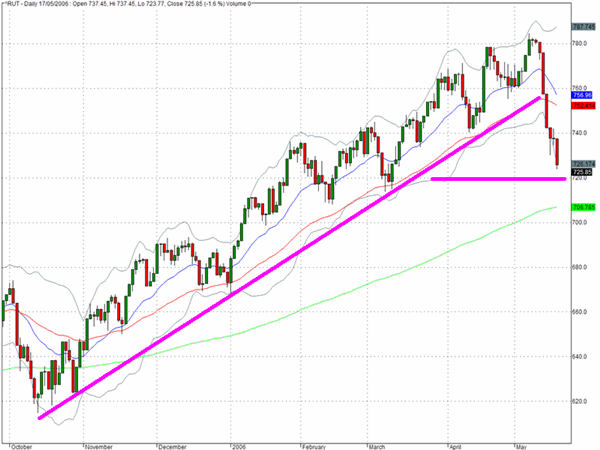
The Russell 2000 cash index (^RUT) moved down by 1.5% and as the chart makes clear the long standing trendline that leads from the Ocober 2005 lows has now been very convincingly violated. While we would not wish to underestimate the damage that is being done to the bullish sentiment that has propelled this index to a series of multi-year highs, we did not see any outright panic selling of small caps yesterday.
This could however be interpreted in a less favorable manner for the bulls as it suggests that we may still not have seen the climactic capitulation which accompanies major turning points.
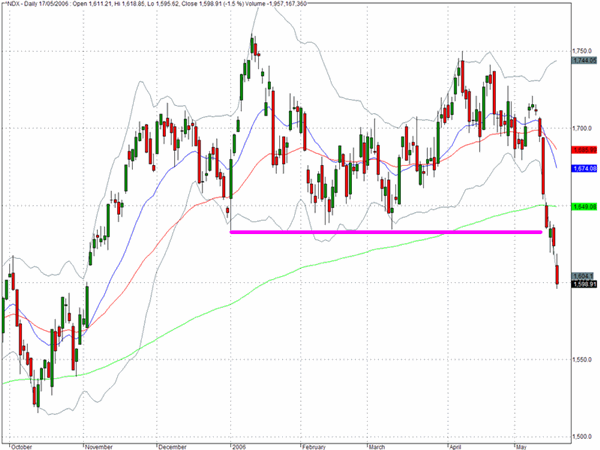
The Nasdaq 100 (^NDX) broke through its January 2 lows which now potentially puts the October 2005 lows in play. The close yesterday below 1600 is almost exactly ten percent below the highs achieved in early January.
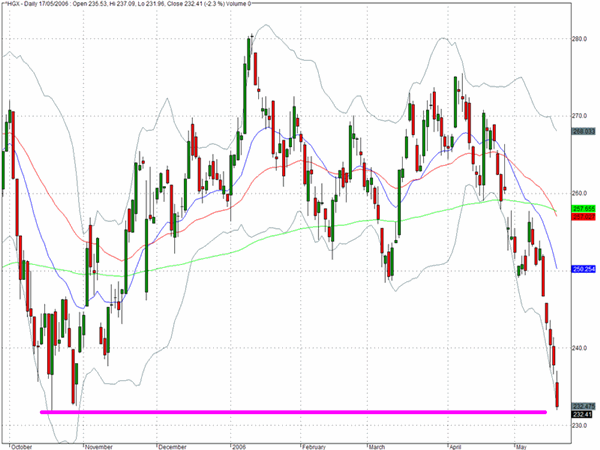
One of the most dramatic looking charts from yesterday's action was for the housing sector index (^HGX). This index has dropped precipitously and is now exactly at the lows from October.
TRADE OPPORTUNITIES/SETUPS FOR THURSDAY MAY 18, 2006
The patterns identified below should be considered as indicative of eventual price direction in forthcoming trading sessions. None of these setups should be seen as specifically opportune for the current trading session.
The CBOE Volatility Index (^VIX) shot up by more than 20% yesterday. We have found that the daily zig zags of this index are becoming less useful as a market indicator because of of the prevalence of trading strategies that are based on statistical arbitrage of volatility dispersion.
However when we see such a decisive upward spike as we did yesterday this still acts as a reliable indicator of the fear levels of the long-only fund managers.
In reviewing dozens of charts for individual stocks, sectors and indices from yesterday it was very hard to find ones that are showing evidence of accumulation or positive basing activity. One of the few charts that, relatively speaking, looks more attractive than most is for one of the two ETF's for the biotech sector, BBH.

Clive Corcoran is the publisher of TradeWithForm.com, which provides daily analysis and commentary on the US stock market. He specializes in market neutral investing and and is currently working on a book about the benefits of trading with long/short strategies, which is scheduled for publication later this year.
Disclaimer
The purpose of this article is to offer you the chance to review the trading methodology, risk reduction strategies and portfolio construction techniques described at tradewithform.com. There is no guarantee that the trading strategies advocated will be profitable. Moreover, there is a risk that following these strategies will lead to loss of capital. Past results are no guarante of future results. Trading stocks and CFD's can yield large rewards, but also has large potential risks. Trading with leverage can be especially risky. You should be fully aware of the risks of trading in the capital markets. You are strongly advised not to trade with capital you cannot afford to lose. This article is neither a solicitation nor an offer to buy or sell securities.