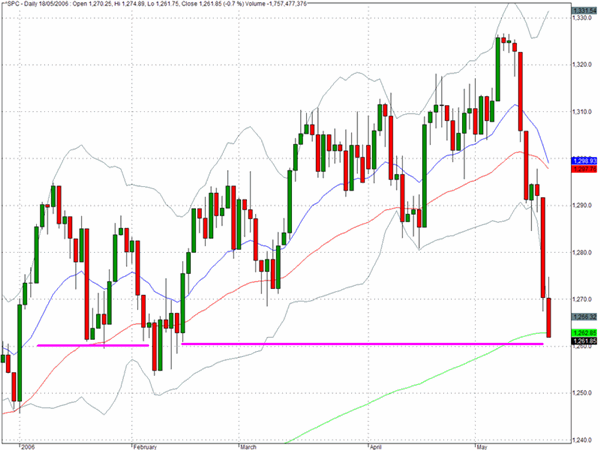
The indices succumbed to further selling late in the trading session yesterday. This was despite a noticeable decline in bond yields and further erosion in the commodities sector. The S&P 500 has now retreated to the 1260 level where, as the chart below suggests, there is an area of previous price support and also a conjunction with the 200-day EMA which lies just one point away from yesterday's close.
We sense that a bounce is due soon and we would not be surprised to see a rather aggressive attempt to squeeze a lot of funds that have become enthusiastically bearish in recent days. At this stage in the decline we would certainly be looking to exit profitable short positions and for those who are persuaded that the markets have further to go on the downside we would expect that there will be more opportune moments ahead to build up new short positions.
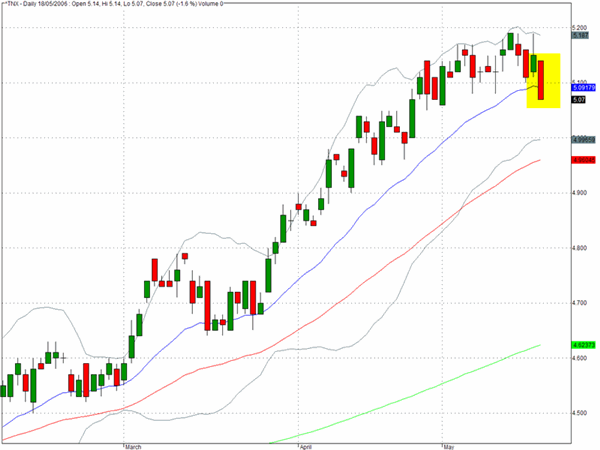
The yield on the 10-year Treasury note declined by eight basis points yesterday to 5.07%. After the run up in yields in the last few weeks a pause is to be expected and as we have commented before there is a clear zone between 4.8% on the low side and 5.4% on the upper zone that we suspect will continue to be explored before the market finds some stability. If the low end of the zone becomes the short term attractor this may help to improve near term sentiment for equities.
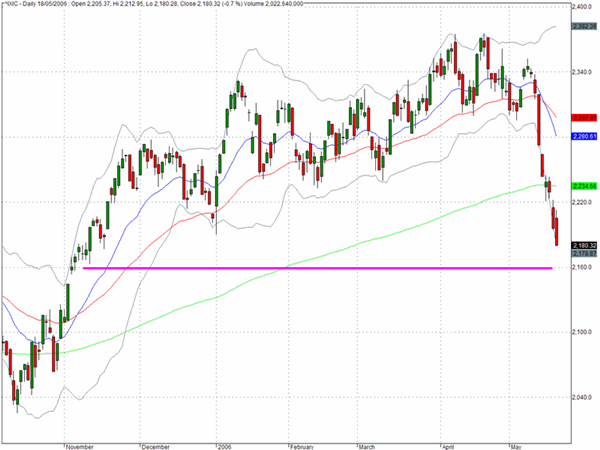
The Nasdaq Composite (^IXIC) continued on its downward trajectory again yesterday and closed at 2180 for a further loss of 0.7%. The index is 50 points below its 200 day EMA but may be approaching an area of price support in the region of 2160. Some of the individual stock patterns are suggesting that the selling may have reached a near term exhaustion point and some recovery efforts are to be expected.
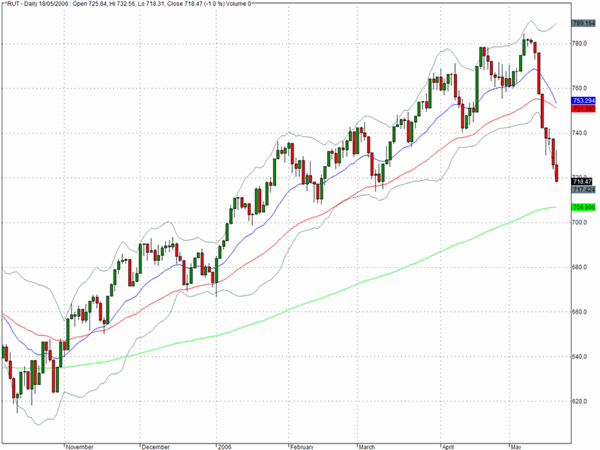
The Russell 2000 (^RUT) was the weakest of the major indices yesterday as it declined by 1% to close just below the 720 level. Once again there is some evidence of price support in this region as it marked the turning point from the selling at the beginning of March but we suspect that longer term we could see a return to the 680 level.
TRADE OPPORTUNITIES/SETUPS FOR FRIDAY MAY 19, 2006
The patterns identified below should be considered as indicative of eventual price direction in forthcoming trading sessions. None of these setups should be seen as specifically opportune for the current trading session.
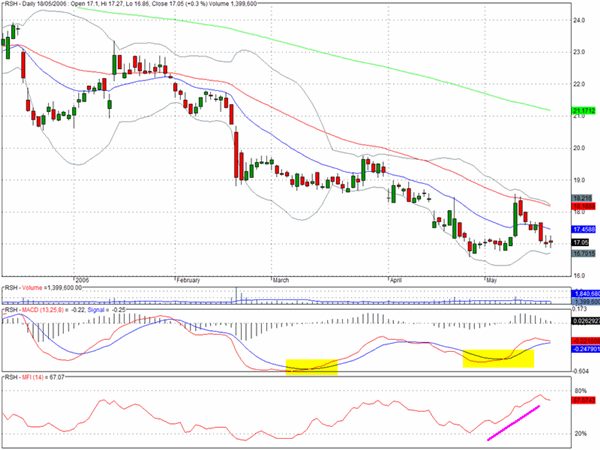
Radio Shack (RSH) has been out of favor since the sell-off in mid February but there are some positive divergences on the chart and there is evidence of accunmulation.
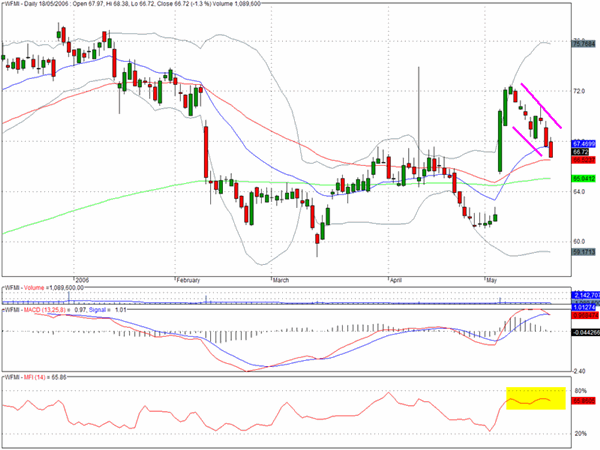
If the markets are ready to bounce we would favor a long position for WFMI as there is a well defined flag formation and the stock has retreated to the 50 day EMA. Volume during the recent market weakness has been fairly subduded and less than the heavier volume that coincides with the long green candle that was registered on May 4th.
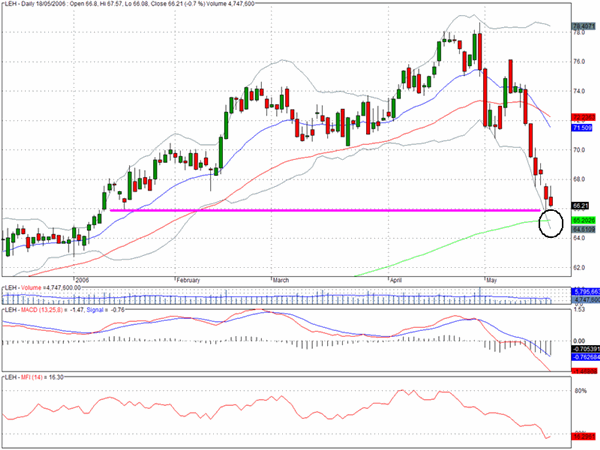
Amongst the investment banks, Lehman Brothers (LEH) has come down hard since late April but is approaching an area where we may see a significant bounce. This would be short term trading opportunity on the long side that may appeal to some, while others may prefer to be patient and wait for a further opportunity on the short side to materialize.
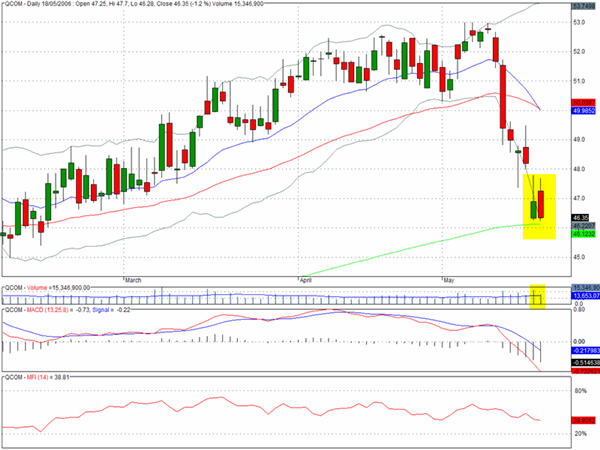
One further recovery trade that could provide a short term opportunity on the long side is for Qualcomm (QCOM) which has retreated to an area where some support may arise. It is worth noting that yesterday's volume was less than for the previous session where it appears some buying interest appeared.
Clive Corcoran is the publisher of TradeWithForm.com, which provides daily analysis and commentary on the US stock market. He specializes in market neutral investing and and is currently working on a book about the benefits of trading with long/short strategies, which is scheduled for publication later this year.
Disclaimer
The purpose of this article is to offer you the chance to review the trading methodology, risk reduction strategies and portfolio construction techniques described at tradewithform.com. There is no guarantee that the trading strategies advocated will be profitable. Moreover, there is a risk that following these strategies will lead to loss of capital. Past results are no guarante of future results. Trading stocks and CFD's can yield large rewards, but also has large potential risks. Trading with leverage can be especially risky. You should be fully aware of the risks of trading in the capital markets. You are strongly advised not to trade with capital you cannot afford to lose. This article is neither a solicitation nor an offer to buy or sell securities.