The structure of this week's market outlook is a bit different than usual. We want to first focus on philosophy and specifically bounces to set the right tone for our chart discussions.
Basically, the burning question is whether or not the selling is over. We've just been through a second extremely bearish week for stocks. Traders, knowing that big moves set up big reversals, have plenty of reason to look for a big bounce. After all, eight straight days of selling should have pretty much flushed out all the sellers, right?
The counter-argument, however, is simply that logic and reason don't always prevail. Yes, the market fell much more than it usually does in a two-week period. And no, there's nothing radically different now than there was two weeks ago, except for stock prices. There's no real reason stocks couldn't continue to fall now that some major technical damage has been done, even if it doesn't make sense.
Obviously, the conflicting schools of thought are going to make the coming week a very tricky one. Let's look at each chart, and discuss both of the what-if scenarios.
NASDAQ Commentary
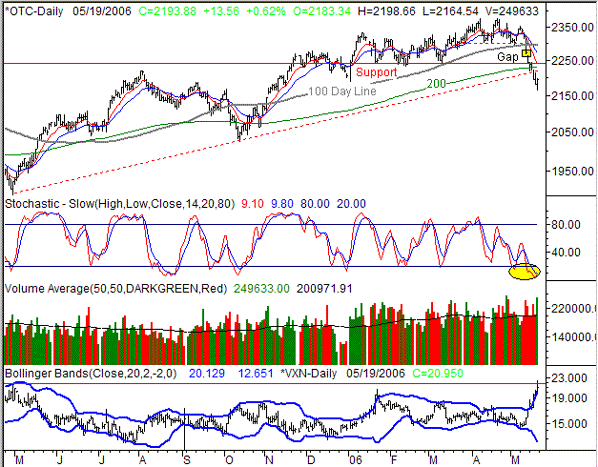
Despite Friday's 13.56 (+0.62%) gain, the NASDAQ still lost 49.9 points (-2.22%) for the week. Plus, the close at 2193.88 is well under the 200-day moving average, where the composite has been for the past three days. You don't fall under all those support lines unless something is really wrong. Yet, we're also seeing some signs that the buyers are re-grouping.
After eight straight days of losses for the NASDAQ, we were due for a day like Friday. The index was just plain oversold, and we had hit extremes on several indicators. Specifically, stochastic lines were well under the 20 "oversold" threshold, and the CBOE NASDAQ Volatility index (VXN) had reached a new 52-week high with a move lasting less than two weeks. In fact, it's the recent shape of the VXN bars that leads us to believe that some more of this extreme oversold situation is going to be whittled away, with at least a small bounce. After reaching a high of 22.30 on Friday, the VXN fell back to 20.95. While the past does not necessarily predict the future, we haven't seen a move like that from the VXN in years. It's just too much too soon, so a bounce is likely. Plus, Friday's volume behind the bullish move was the highest volume day we've seen in weeks. So, the buyers seem to be getting impatient and ready to step in.
How high will that bounce carry the NASDAQ? The high end is at 2294, while the more likely target is 2250. That's where the 100-day line and the 10-day line are residing, respectively.
But from a bigger-picture view, the damage has largely been done. The NASDAQ has made a few closes under the important 200-day moving average, and a long-term support line (red, dashed) has been breached. Once the VXN is reeled in a bit, we're looking for the weakness to kick in again. There may only be a few days of bullishness, at best.
NASDAQ Chart

S&P 500 Commentary
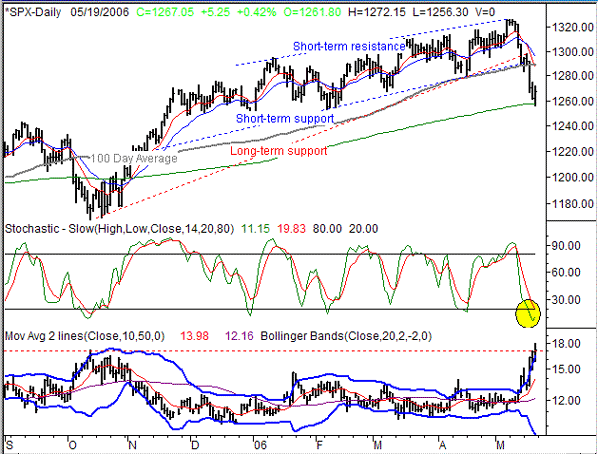
The S&P 500 managed to close 5.25 points higher (+0.42%) on Friday, but was still in the red for the week. The close at 1267.05 was 24.20 points under last Friday's close, booking a loss of 1.87% over the last five trading days. However, a case for a bullish bounce can definitely be made for the SPX. We wouldn't go as far as saying it's going to be a big bounce. Let's just say there are always people looking for any excuse to buy stocks, and they have it as of Friday.
The CBOE Volatility Index (VIX) hit a new 52-week high of 180.01 before settling in to close at 17.18. That close was just a fraction above Thursday's close of 16.99, so the upward momentum there is starting to dwindle. At the same time, the index is very stochastically oversold.
More than anything, though, is Friday's gain after support was made at the 200-day moving average line on the same day. Yes, the index actually traded under the 200-day line on Friday when it hit a low of 1356.30, but that's still very precise. We have to wonder if the buyers were just waiting to use it as an entry point. If so, it's very possible that they'll keep at it for a while.
But like the NASDAQ, there's just been too much technical damage done to expect a full-blown recovery. Long-term and short-term support lines have been broken, and that can't be undone. The most likely short-term high point will probably be around 1289, where the 100-day and 10-day lines have converged. After that, we still contend that we're headed lower. Only a close above 1289 would force us to rethink that.
S&P 500 Chart

Dow Jones Industrial Average Commentary
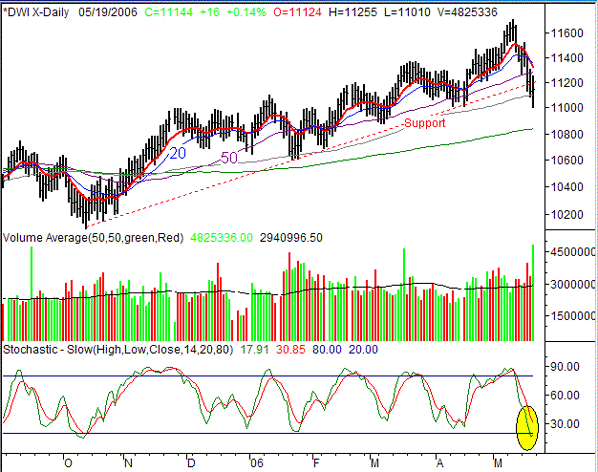
The bigger they are, the harder they fall. In this case, these blue chip stocks that had been leading the market so well suffered the biggest meltdown of all. The Dow Jones Industrial Index continued to lag on Friday, only gaining 16 points (+0.14%) to end the week at 11,144. That translates into a 237 point loss (-2.08%) for the week -- the biggest loser of all three indices. And although the Dow has as much of a chance at a short-term bounce as any index, on a relative basis, they still have the most downside potential.
The idea is basically the same. We may see a slight bounce, but we think the bigger trend is going to remain generally bearish. The ceiling is at 11,350, near where the 10- and 20-day moving averages are currently resting. And given the major bullish volume we saw on Friday, it's clear that there are still willing and interested buyers out there.
We'll place support (for now) at the 200-day line, or 10,838. That may not be the final ending point for the downtrend, but that will be our first checkpoint.
Dow Jones Industrial Average Chart

Price Headley is the founder and chief analyst of BigTrends.com.