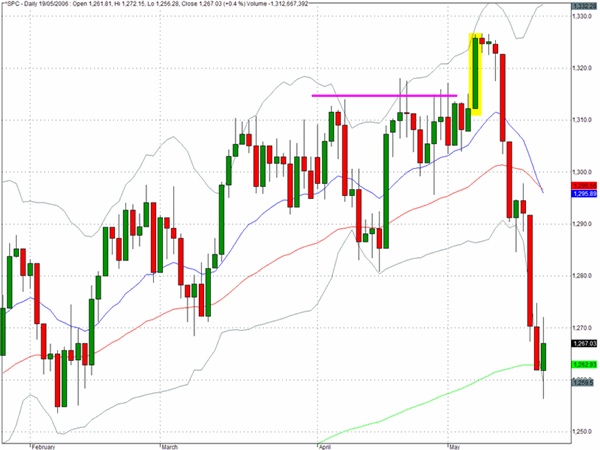
The S&P 500 dropped back 1.9% in last week's trading and reached an intra week low of 1256 which more or less coincided with the 50 week EMA. On the daily chart it is also apparent that Friday's close at 1267 appears to have found support at the 200 day EMA. The fact that many stocks appear to be temporarily sold out and the respite in the selling that appeared on Friday at important levels of chart support suggests that we may be heading for a relief rally over the coming week.
What strikes us most in reviewing the action over the last month is the long green candlestick we have highlighted which ocurred on Friday May 5th and which saw the S&P 500 index make an apparently decisive break above the congestion zone around 1310 and led us to a multi-year closing high at 1325.
On that day many traders seemed very content with the employment data that had just been released and there was a strong focus on pushing the DJIA toward its all time high. With the benefit of hindsight and the clear signs of major shifts in asset allocation that have taken place since, there is an implied warning to suspect price breakouts until you have confirming evidence that allows you to respect price breakouts.
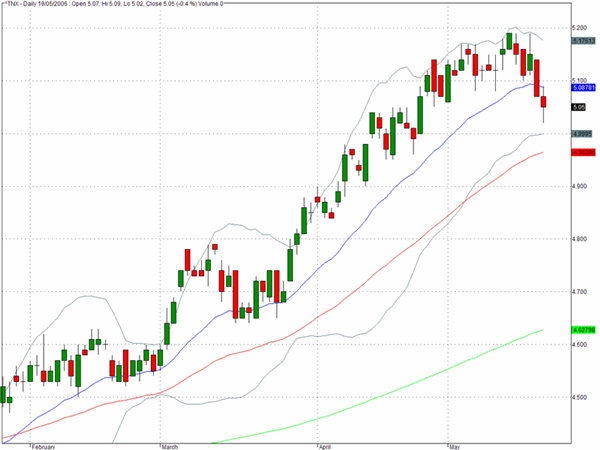
The yield on the ten year Treasury note declined again on Friday and closed the week at 5.05%. We continue to monitor the Treasury market very closely and would suggest that amidst all of the chatter about inflation and commodity prices, this benchmark yield is most likely to be the one single indicator that will help us assess the real risks to the equity market. We have seen a pullback from the 5.2% yield achieved just a week ago but it is too soon to declare that we have seen an intermediate peak in yields.
The weekly chart of the Nasdaq Composite (^IXIC) highlights that this index has reached a level where two key support levels have converged. The trendline through the weekly lows since mid 2004 has coincided with the 200 week EMA.

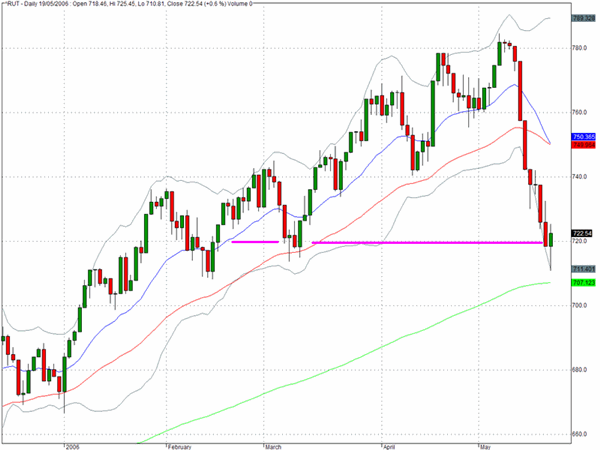
The Russell 2000 (^RUT) found support at the 720 level on Friday after touching 710 intraday and volume picked up noticeably on the IWM proxy. We would expect an effort to rally back to the 740 level in coming sessions and will then be watching carefully to see how much conviction there is on the rebound.
TRADE OPPORTUNITIES/SETUPS FOR MONDAY MAY 22, 2006
The patterns identified below should be considered as indicative of eventual price direction in forthcoming trading sessions. None of these setups should be seen as specifically opportune for the current trading session.
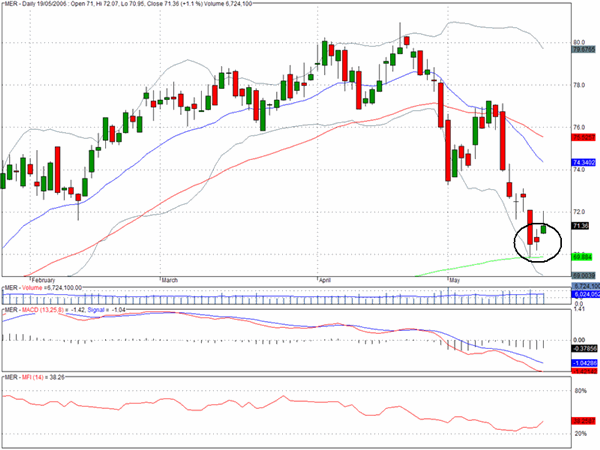
The brokers have been one of the major casualties over the last month and some would appear to be ready to mount a relief rally. Merrill Lynch (MER) could be one of those in a good position for a quick bounce.
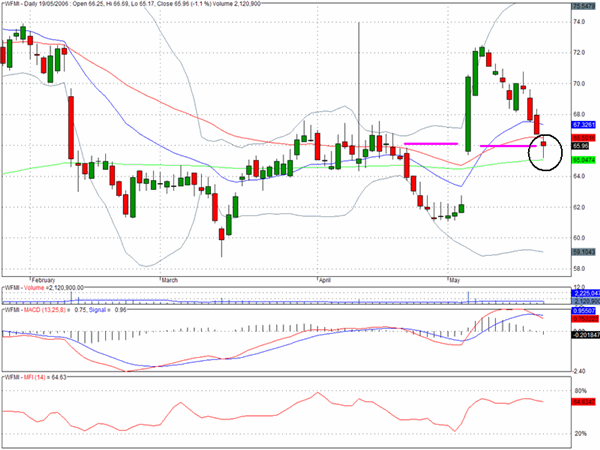
Whole Foods Market (WFMI) could also be setting up for a rally as it has reached down to an area of chart support and we like the volume characteristics, showing that there has been modest volume on the retreat that has occured since the powerful upsurge on May 4th.
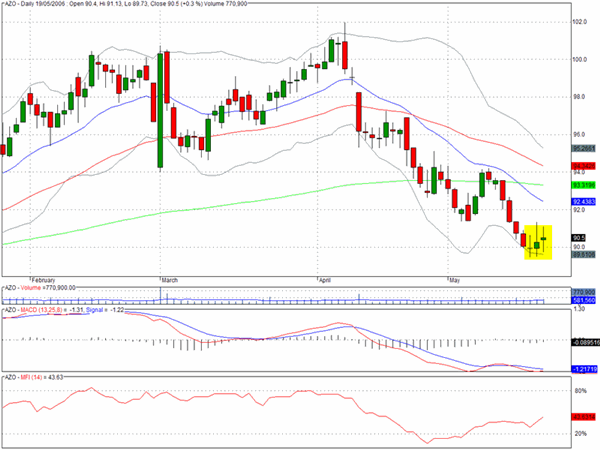
One other chart that suggest a rally may be due is for Autozone (AZO) which has some positive momentum and money flow divergences. Our profit target would be set realistically at the $94 level.
Clive Corcoran is the publisher of TradeWithForm.com, which provides daily analysis and commentary on the US stock market. He specializes in market neutral investing and and is currently working on a book about the benefits of trading with long/short strategies, which is scheduled for publication later this year.
Disclaimer
The purpose of this article is to offer you the chance to review the trading methodology, risk reduction strategies and portfolio construction techniques described at tradewithform.com. There is no guarantee that the trading strategies advocated will be profitable. Moreover, there is a risk that following these strategies will lead to loss of capital. Past results are no guarante of future results. Trading stocks and CFD's can yield large rewards, but also has large potential risks. Trading with leverage can be especially risky. You should be fully aware of the risks of trading in the capital markets. You are strongly advised not to trade with capital you cannot afford to lose. This article is neither a solicitation nor an offer to buy or sell securities.