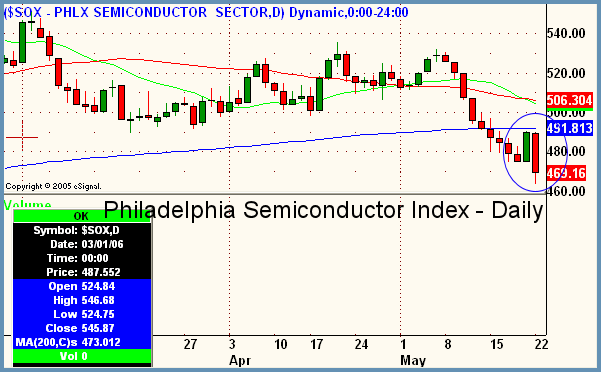
Good Morning, Traders. Interesting point about the markets yesterday is that we opened up with a gap down, with no economic data on the slab. It's probably still a little early for the capitulation we discussed in Monday's report, but could this be a sign of bulls beginning to throw in the towel? Not sure. All we can do is look at the charts as objectively as possible and bring as many different data points into our analysis as possible. One of the things that I teach is that the Philadelphia Semiconductor Index ($SOX) is used as a market internal right alongside the breadth, advance decline lines, and TRINs to foreshadow future market movements. Although we generally use this as an intraday indicator, I feel that it can be used on larger timeframs as well. Today's chart is a daily of the $SOX. The main point to note is the last two days of price action, which are circled in blue. After nine straight days of losses, the semis managed to put in an up-day on Friday. Note, however, how Monday's trade not only completely negated this rise, but actually took blue chip stocks to a new swing low. This would indicate to us that there is very little demand for these stocks right now. When an index or stock has sold off for that many days and then can only manage a one-day retracement before moving even lower, it has to be construed as bearish. The semis generally lead the Nasdaq Composite which in turn also tends to foreshadow moves in the S&P and Dow. Certainly, in this area of sideways consolidation after last week's brutal selloff, it does not help the bull's case at all for a bounce here if the semiconductor issues refuse to participate. Overall bias remains up in the S&P and Dow and sideways to down in the Nasdaq Composite. Near-term bias is sideways right now in all indices.

Peter Reznicek is the Chief Equity Strategist and a principal of the Prana Fund, a domestic hedge fund, and ShadowTrader, a subsidiary of thinkorswim which provides coaching and education to its clients on both intraday and swing trading of equities. For a free trial to the full version of The Big Picture or to learn about ShadowTrader's other services, visit shadowtrader.net or send an email to preznicek@shadowtrader.net.