The S&P 500 declined a further 0.4% yesterday but still remains within the vicinity of the support level that we discussed in our weekend commentary. Whether this area will contain the correction for the time being before we see some kind of bounce may become clearer today. The 2006 low was recorded on the first trading day of the year and lies another 17 points below where we closed yesterday.
We are witnessing a global market contagion phenomenon where liquidity has evaporated in many emerging markets and some dramatic asset managment decisions are being made that are causing tumult in the commodities sector as well as the equities markets. The UK's FTSE index continued its plunge in trading yesterday (22nd) but as this is being written a sizable recovery seems to be under way. The US stock indices, when they do bounce, could move quite aggressively higher but there has clearly been a change in the underlying market dynamics which should suggest a cautious approach on any short term trading strategies to play the bounce.

The semconductor sector, as represented by the exchange traded fund, SMH, continues to probe new 2006 lows and yesterday declined a further 2.7%. Amongst the constituent stocks KLAC dropped more than ten percent yesterday, but AMD could be ready to move higher when the overall market weakness abates.
In general terms, we would not be looking to initiate new short positions at the moment as the relief rally when it comes could be quite aggressive.

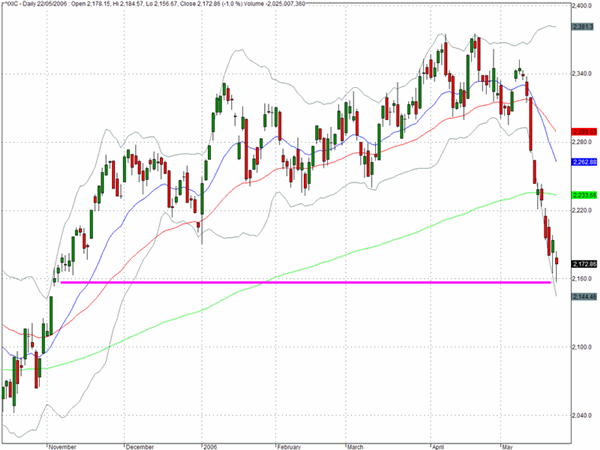
The chart of the Nasdaq Composite (^IXIC) reveals just how difficult it has been to identify areas of potential support. We have seen the index plunge through the 200 day EMA, then the 2006 low and now we are at the lower 50 day volatility band. It seems quite probable that following a bounce we may well see a revisit to the October 2005 lows.

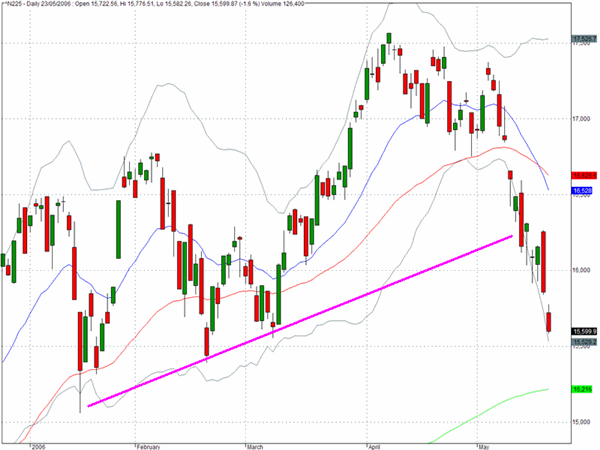
The Nikkei 225 declined another 1.5% in overnight trading (23rd) and may eventually be headed to the 15200 level which marks the 2006 lows and the 200 day EMA.

TRADE OPPORTUNITIES/SETUPS FOR TUESDAY MAY 23, 2006
The patterns identified below should be considered as indicative of eventual price direction in forthcoming trading sessions. None of these setups should be seen as specifically opportune for the current trading session.
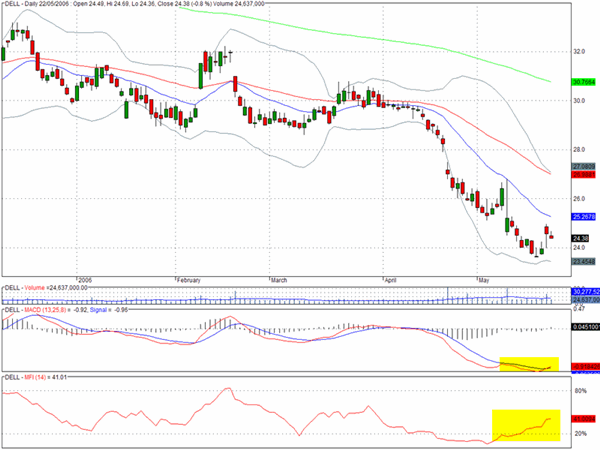
The chart for Dell Computers (DELL) suggests that the stock is waiting for an excuse to move higher.

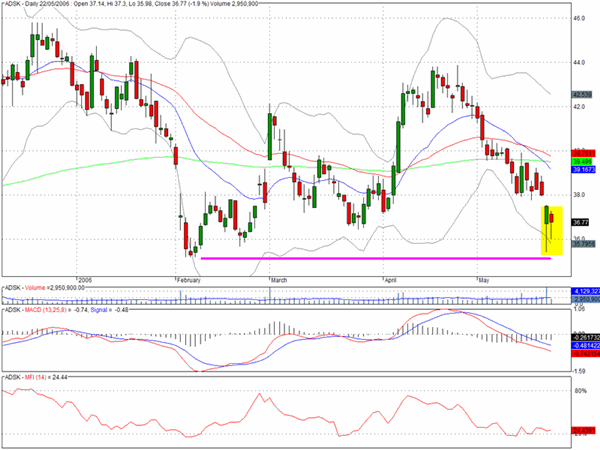
Autodesk (ADSK) registered an inside day on lighter volume following Friday's bullish looking hammer candlestick. As we noted for Dell this stock could also bounce nicely if we see the markets pause from the recent selling pressures.

Clive Corcoran is the publisher of TradeWithForm.com, which provides daily analysis and commentary on the US stock market. He specializes in market neutral investing and and is currently working on a book about the benefits of trading with long/short strategies, which is scheduled for publication later this year.
Disclaimer
The purpose of this article is to offer you the chance to review the trading methodology, risk reduction strategies and portfolio construction techniques described at tradewithform.com. There is no guarantee that the trading strategies advocated will be profitable. Moreover, there is a risk that following these strategies will lead to loss of capital. Past results are no guarante of future results. Trading stocks and CFD's can yield large rewards, but also has large potential risks. Trading with leverage can be especially risky. You should be fully aware of the risks of trading in the capital markets. You are strongly advised not to trade with capital you cannot afford to lose. This article is neither a solicitation nor an offer to buy or sell securities.