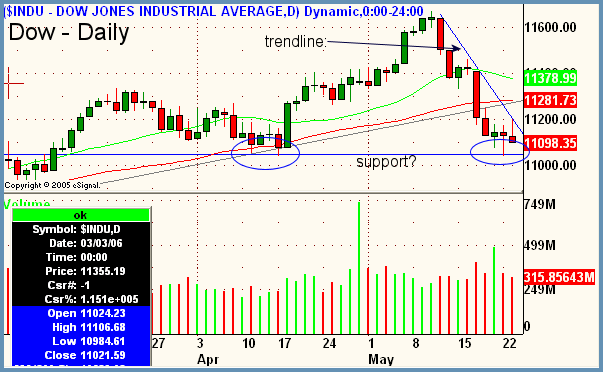
Good Morning, Traders. A slight gap up on Tuesday morning on no economic data eventually faded hard into the close and left the major averages red once again. The Dow lost 26.98 (closing within 100 points of 11,000), the S&P was down by 5.49, and the Nasdaq Composite shed 14.09 on the heels of some extreme weakness in the $SOX which was down 1.62% from its open. We discussed weakness in the $SOX in yesterday's commentary. Although a lot of indicators are starting to read oversold, we still have not broken trend in the major averages. The chart below of the Dow clearly shows that the downdraft that began on May 11 is still not broken. The blue line which connects the highs from that date is clearly still unbroken. Only upon prices piercing this line to the upside and holding for at least a few hours will bears see any need to begin to cover their positions. Although the outlook here is certainly bearish, I cannot advocate getting majorly short just yet as any break of the blue line below could provide a relief rally. Market remains in a short-term holding pattern as earnings season is drying up and investors are wondering what the next catalyst will be to push prices in one direction or another.

Focus List

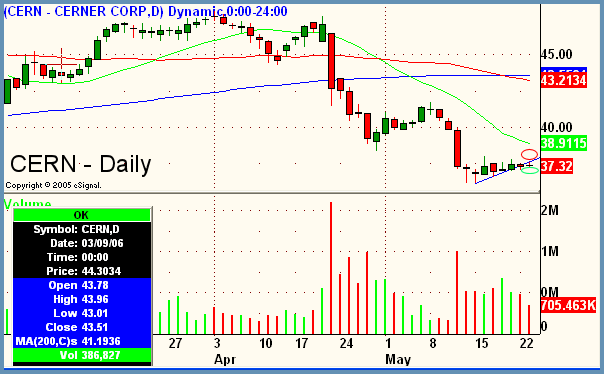
CERN - Cerner Corporation
Industry - Software
Side - Short
Trigger - 37.10
Stop - 38.10
Target - 35.00-
Timeframe - 1 - 3 weeks
Notes
- Stock has recently broken a 50% Fibonacci retracement from prior stage move and looks to be headed to the 61.8% retracement level which is currently at 34.24.
- Low volatility recently offers good risk reward if stock breaks downward.

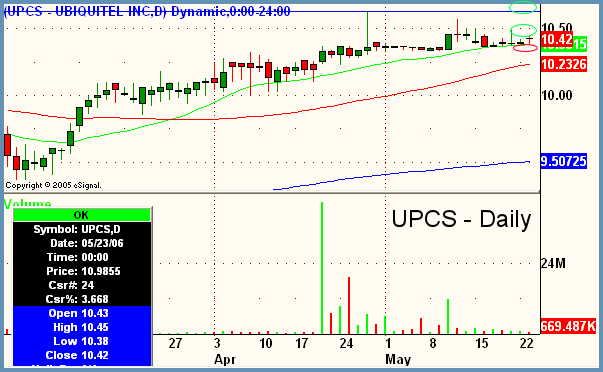
UPCS - Ubiquitel, Inc.
Industry - Telecommunications (Wireless)
Side - Long
Trigger - 10.50 / 10.68
Stop - 10.25
Target - 11.25+
Timeframe - multiweek
Notes
- Offering two trigger areas for scaling in.
- First entry is over yesterday's high, second is actual breakout which is safer.
- Stock is showing a lot of relative strength as of late by not breaking down with broad market.
Peter Reznicek is the Chief Equity Strategist and a principal of the Prana Fund, a domestic hedge fund, and ShadowTrader, a subsidiary of thinkorswim which provides coaching and education to its clients on both intraday and swing trading of equities. For a free trial to the full version of The Big Picture or to learn about ShadowTrader's other services, visit shadowtrader.net or send an email to preznicek@shadowtrader.net.