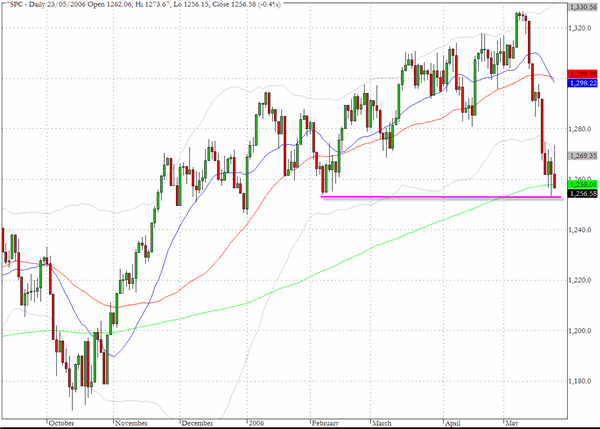
The S&P 500 declined again in yesterday's trading but we sense that some institutional support may be emerging to try to hold, at least temporarily, in the neighborhood of 1260 and the 200 day EMA. While some other indices are much closer to their October 2005 lows, the S&P 500 would have to drop another 80 points from where it closed yesterday to re-examine the 1180 level.
In the current environment a further wave of major selling certainly is entirely possible and we sense that there is a lack of conviction behind the buyers that may be trying to mount some kind of relief rally.
What seems even more unusual is that the aggressive short selling appears to have abated and yet there has been no real attempt to apply any squeeze strategies to see how anxious the abundance of traders with bearish positions may actually be.
The chart for the Nasdaq 100 (^NDX) looks a lot more vulnerable to continuing decline towards the October lows which are in the vicinity of 1520 and only about three percent from yesterday's close at 1569.

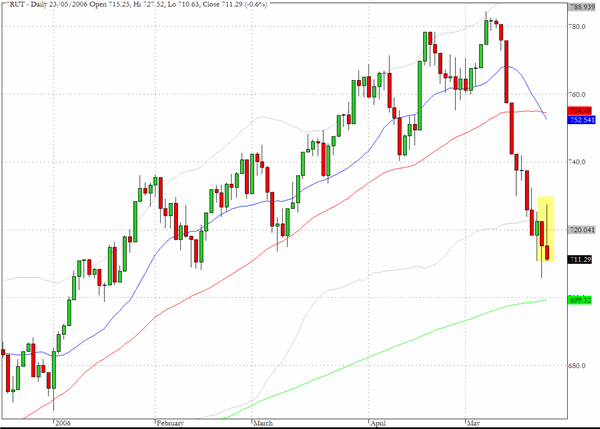
The Russell 2000 (^RUT) registered a long upper shadow to its candlestick formation yesterday as it tried and failed to restore the 720 level. Volume for the exchange traded proxy, IWM, came in about 50% above its average daily volume (15 day SMA) and on that chart the index proxy closed exactly on its 200 day EMA. As the cash index reveals we have further to go to the equivalent level which lies just below the 700 level.
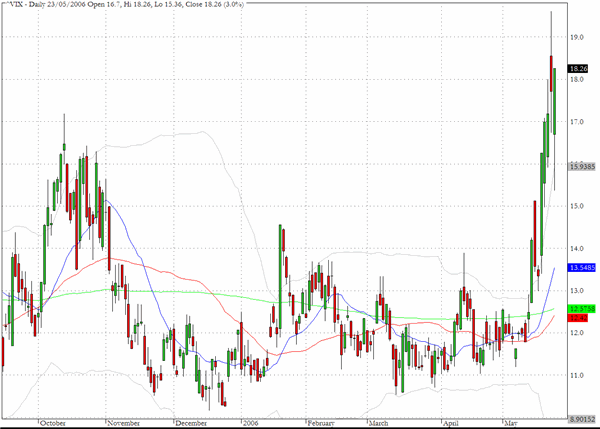
Just how far the markets have been rattled in the last ten days is evident on the chart for the CBOE Volatility Index (^VIX) which may not be that revealing as an indicator in "normal" trading conditions but which tends to expose the fear element in the market when more extreme conditions prevail.
We have spiked far above the high values from the fall of 2005 and in yesterday's trading we moved back quite notably towards the highs around 20 that were touched in Monday's trading.
TRADE OPPORTUNITIES/SETUPS FOR WEDNESDAY MAY 24, 2006
The patterns identified below should be considered as indicative of eventual price direction in forthcoming trading sessions. None of these setups should be seen as specifically opportune for the current trading session.
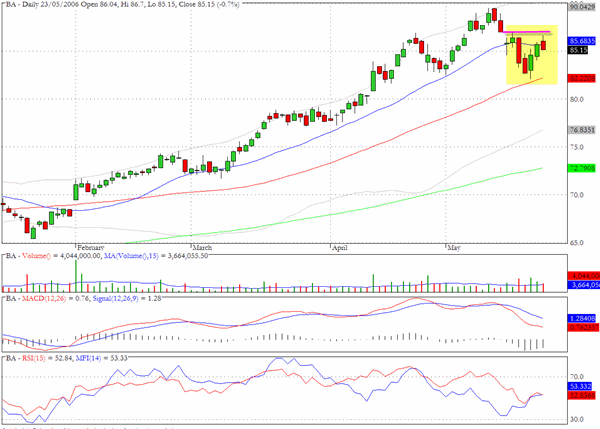
Boeing (BA) looks vulnerable amongst the Dow components to further weakness.
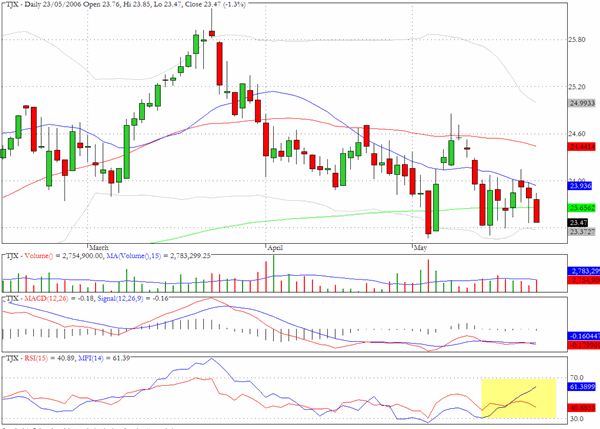
TJX came to our attention in our daily scans because of the unusually strong money flow characteristics.
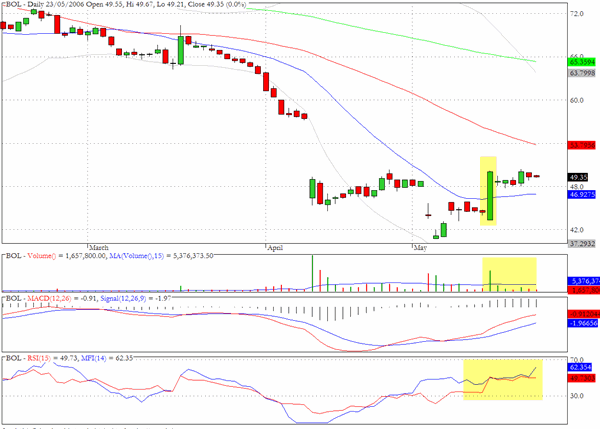
Another chart that also has some positive divergences is for Bauch & Lomb (BOL) but we have not been too successful this week in trying to identify bounce candidates and short term oportunities on the long side, so we would recommend extreme caution in instigating any new positions, long or short, at the moment.
Clive Corcoran is the publisher of TradeWithForm.com, which provides daily analysis and commentary on the US stock market. He specializes in market neutral investing and and is currently working on a book about the benefits of trading with long/short strategies, which is scheduled for publication later this year.
Disclaimer
The purpose of this article is to offer you the chance to review the trading methodology, risk reduction strategies and portfolio construction techniques described at tradewithform.com. There is no guarantee that the trading strategies advocated will be profitable. Moreover, there is a risk that following these strategies will lead to loss of capital. Past results are no guarante of future results. Trading stocks and CFD's can yield large rewards, but also has large potential risks. Trading with leverage can be especially risky. You should be fully aware of the risks of trading in the capital markets. You are strongly advised not to trade with capital you cannot afford to lose. This article is neither a solicitation nor an offer to buy or sell securities.