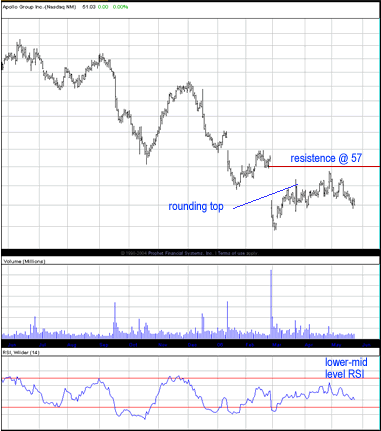
Apollo Group, Inc (APOL) is in a bearish technical state. The stock was recently showing relative strength in the weak market environment, but that soon changed. After gapping down, APOL inched back into the gap and almost filled it until topping out and beginning to move lower. The chart shows the near completion of a rounding top, suggesting there is still some downside action left in APOL. RSI levels are at mid-range trending lower, also suggesting continued downside action.
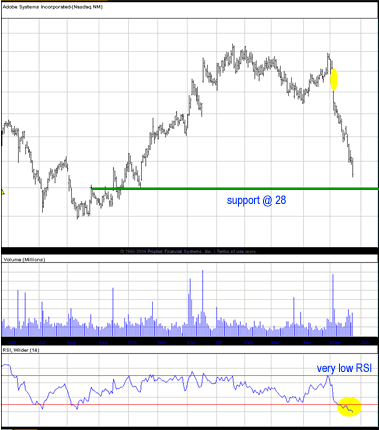
After putting in an exhaustion gap (highlighted in yellow on the chart below), Adobe Systems Inc (ADBE) took a nose dive. Is it time to consider a long position in ADBE? Well it's tough to go long in any stock in the current environment, but ADBE does look fairly attractive and here's why. ADBE's RSI levels are extremely low, just below 20. This is a very strong indicator that the stock is oversold. Also, ADBE is coming up on some nice support at 28.
Google Inc (GOOG) had an interested day in Tuesday's trading session. The stock began by gapping up, then continued moving higher as the morning progressed. Towards the end of the day, I noticed that the second shoulder on a potential Head & Shoulders pattern was forming. From that point, I watched GOOG very closely. As soon as I saw a break throug the neckline, and a break of 380 resistance just below the neckline, I knew this was in fact a genuine H&S pattern. I ended up shorting GOOG on the retrace to the neckline and cashed in a 0.45% gain in a matter of minutes. What will GOOG do next?
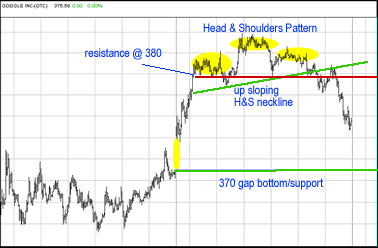
The market reversed at the end of the trading session Tuesday. If the market continues to weaken, GOOG will quickly drop, fill Tuesday's gap up, and test support at the gap bottom at 370.
Andy Swan is co-founder and head trader for DaytradeTeam.com. To get all of Andy's day trading, swing trading, and options trading alerts in real time, subscribe to a one-week, all-inclusive trial membership to DaytradeTeam by clicking here.


 Free Festival of Traders Videos