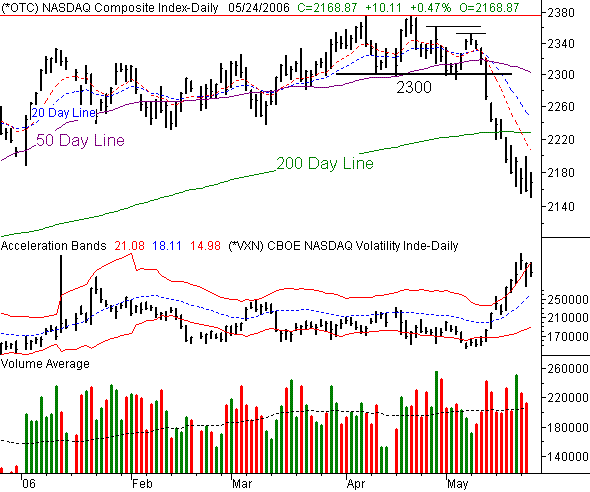
It looks like we may be getting a bit of a reprieve today. Then again, it looked like that yesterday too, and the NASDAQ got crushed in the latter part of the session. So, we don't want to read too much into Wednesday's slight gain (a big chunk of which, by the way, has been given back). For the day, the composite is up by 10.11 points (+0.47%), currently trading at 2168.87. For the week, it's still down by 25 points (-1.14%). And, the technical damage that was inflicted can't be undone although we still contend that there's some sort of bounce in the making.
Most of the comments are for the S&P 500 and the Dow today (below), but we did want to highlight a couple of important things on the NASDAQ's chart.
First and foremost, notice that we saw a higher high and a higher low on Tuesday. The close was a new trend low close, but we still saw some hints of upside pressure after 10 straight sessions of lower lows and lower highs. At the same time, the NASDAQ Volatility Index (VXN) appears to have peaked, and is starting to pull back after getting run up to 23.84 on Monday.
We'll also point out that Monday's and Tuesday's volume, although bearish, was still shrinking volume, indicating that the number of sellers is finally waning.
That said, what else do you expect after falling 7.6 percent over a two-week stretch? Don't confuse any brief rebound here with real (longer-term or intermediate-term) strength. If the NASDAQ can get back above the 200-day average, then we'll start considering the bullish possibilities. Anything other than that, and we'll just chalk any buying up to simple volatility.
NASDAQ Chart

S&P 500 Commentary
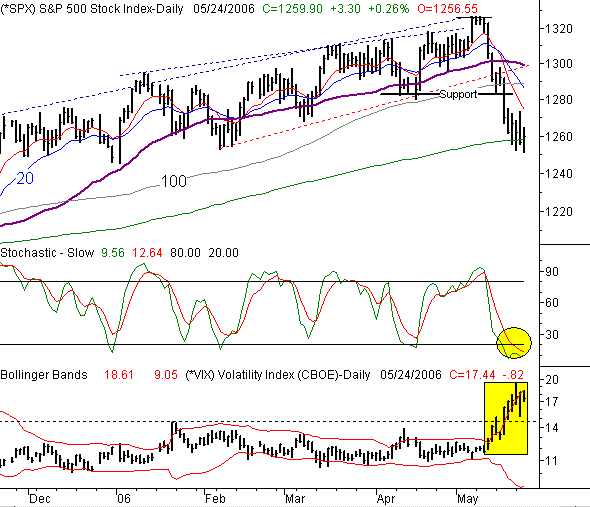
The S&P 500's current reading of 1259.90 is 3.30 points (+0.26%) better than yesterday's close. However, for the week, it's still in the hole by 7.15 points (-0.56%). And like the whole market, the recent plunge has a lot of bottom-fishers testing the water, anticipating that most of the selling is over. But for the SPX, there's a specific reason why the recovery effort might be made now.
When the support line at 1283 was broken last week, the S&P 500 went down in a blaze of glory. But really, since that one-day plunge, the SPX has been relatively stable, and even given a few hints of upside pressure. The biggest reason for that strength is the 200-day line, which the index intercepted last week, but only closed under once, Tuesday. Today, we made a new trend low of 1251.80, but the buyers seem to want to keep the market above that critical 200-day moving average line. Plus, as oversold as we are, it's not a shock to see some buyers get interested.
As you'll read with the Dow commentary, we're at a crossroads, with the issue being confused by being in the wake of one of the worst two-week periods we've seen in months. The obvious question (as always) is "what's next?" Well, with the support we're seeing at the 200-day average paired with the fact that the CBOE Volatility Index (VIX) is starting to move lower again, we have to at least consider the idea that the sellers may be done for a while.
Is that a bullish call then? No. There may be enough of a bounce to squeeze in a quick upside trade, but the bigger picture remains bearish. Realistic levels that may halt any advance are the combined 100- and 20-day moving average lines at 1288, or even the 50-day line at 1300. But that's about as bold as we'd want to be. The last few days sent a pretty clear message that stocks are far from safe. That kind of sentiment can take a toll on the longer-term trend once enough damage has been done.
By the way, if we don't get a bounce before we see a couple more closes under the 200-day line at 1258, you can forget about the bounce. It will get put on hold while even more stock-holders bail out.
S&P 500 Chart

Dow Jones Industrial Average Commentary
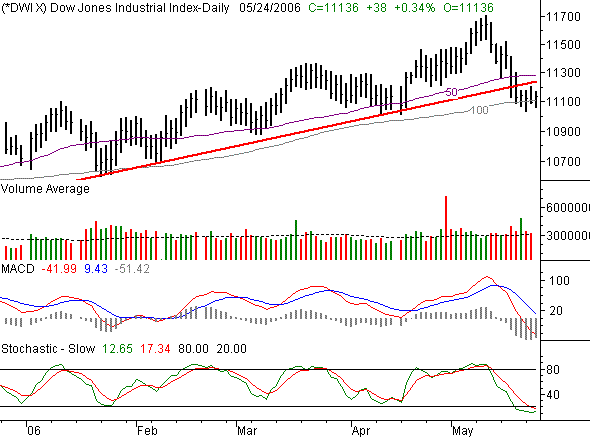
The Dow's 38 point gain today (+0.34%) brings it up to 11,136. However, it's still 8 points under last Friday's close. That's a breakeven as far as we're concerned, but more importantly, it verifies our suspicion last week that the Dow was poised to hold up the best if things got worse (which they did). Despite a couple of incredibly harsh selloffs last week for the blue-chip index, we still contend that the Dow is relatively the strongest of the indices - now that it's been reeled in.
All the same, the strongest index in a bearish market is still bearish.
Last week's update, at the time it was published, the Dow was still holding above the 50-day line, the 100-day line, and the long-term support line that was sandwiched between those two moving averages. Well, by the end of that day, the 50-day line was breached and the support line was under attack. By the end of the week, only the 100-day moving average was still intact as support. And given that it's still basically intact, we have to respect the Dow's chances at making a recovery effort right here.
So basically, we're at a cross-roads. If the Dow can close above 11,281 where the 50-day line is, then this wave of selling might be over. In that case, the next resistance level is thr prior high of 11,709. If instead we see a close under the recent low of 11,040, then that may set off another wave of selling as the next group of stock-owners decides things have become too painful.
We'll just add that after a harsh two weeks, the Dow is very stochastically oversold, and the 100-day line has been surprisingly strong support. In that light, a bounce here wouldn't be a shock. The question is, will that be the beginning of a bigger move? Unless we do indeed get and close above 11,281, we'd have to say no. So, be patient and disciplined here.
Dow Jones Industrial Average Chart

Price Headley is the founder and chief analyst of BigTrends.com.