The most notable pattern that we found in our daily scans was the long legged Doji candlestick formation in which there was little difference between the close and open prices but there were long lower and upper shadows. The S&P 500 and Russell 2000 indices both provide good examples and both were recorded in the neighborhood of their respective 200 day EMA's.
The patterns suggest that a tradable bounce may be imminent, and short term trading opportunities could be quite rewarding, but this remains a high risk environment and trading against the intermediate trend can sometimes be hazardous to your wealth.
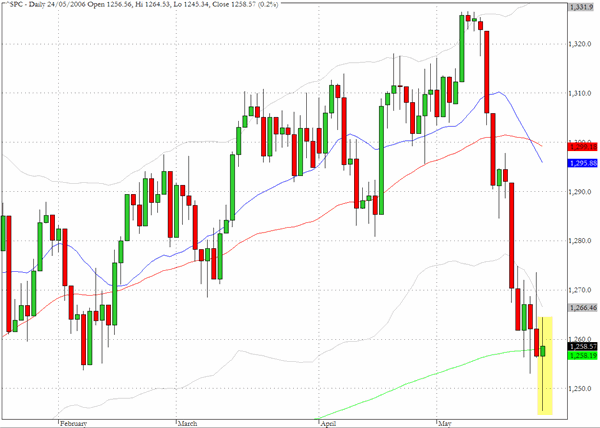
The Nasdaq 100 (^NDX) managed to move up 0.7% yesterday and registered a rather long lower tail as buying support appeared just above the 1550 level.
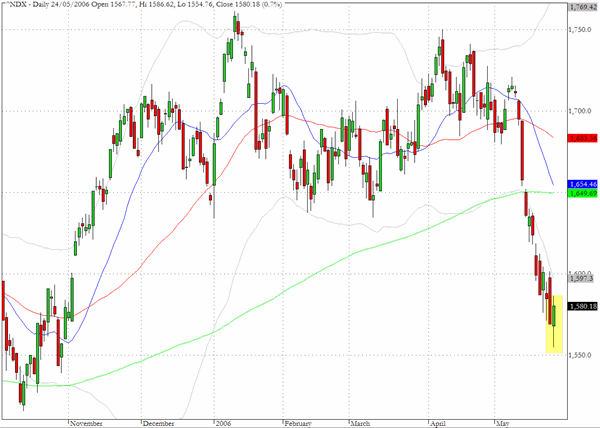
The chart for the Russell 2000 (^RUT) shows a classic example of the long legged Doji candlestick pattern we mentioned previously. The fact that the very long lower shadow bounced off a spike below the 700 level and the 200-day EMA can be construed as further evidence that the indices could be ready to mount a relief rally.

TRADE OPPORTUNITIES/SETUPS FOR THURSDAY MAY 25, 2006
The patterns identified below should be considered as indicative of eventual price direction in forthcoming trading sessions. None of these setups should be seen as specifically opportune for the current trading session.
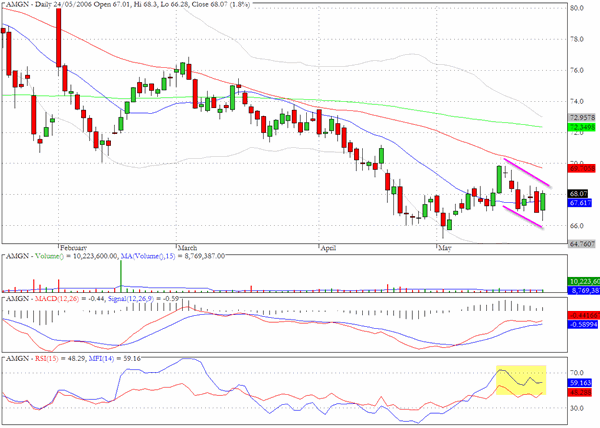
Amgen (AMGN) has a constructive looking chart and it appears that the stock is being accumulated.
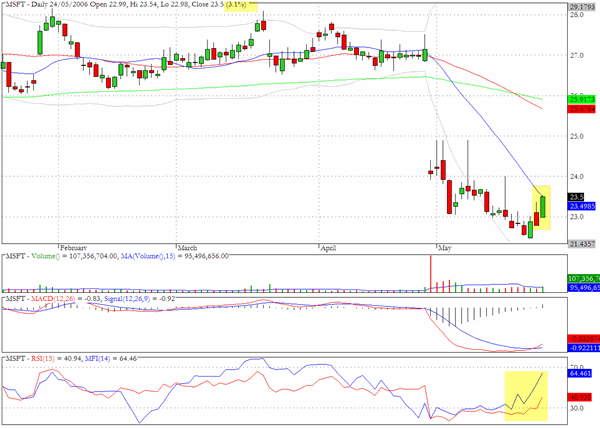
Microsoft (MSFT) moved up more than 3% yesterday and the momentum and money flow charts suggest that there is accumulation occuring for the stock.
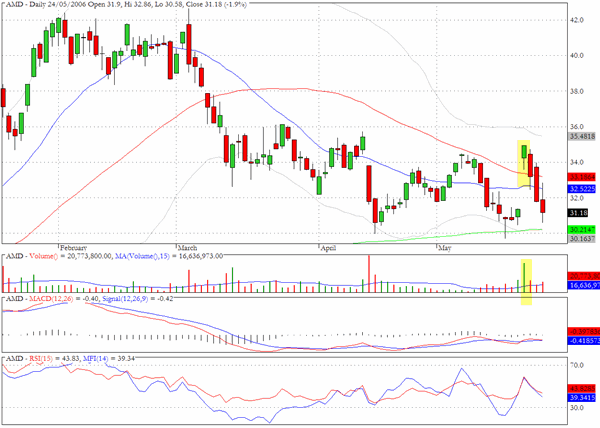
Advanced Micro Devices (AMD) gapped up on heavy volume on May 19th and we suspect that when the markets do stabilize we would expect to see a resumption of the buying interest.
Clive Corcoran is the publisher of TradeWithForm.com, which provides daily analysis and commentary on the US stock market. He specializes in market neutral investing and and is currently working on a book about the benefits of trading with long/short strategies, which is scheduled for publication later this year.
Disclaimer
The purpose of this article is to offer you the chance to review the trading methodology, risk reduction strategies and portfolio construction techniques described at tradewithform.com. There is no guarantee that the trading strategies advocated will be profitable. Moreover, there is a risk that following these strategies will lead to loss of capital. Past results are no guarante of future results. Trading stocks and CFD's can yield large rewards, but also has large potential risks. Trading with leverage can be especially risky. You should be fully aware of the risks of trading in the capital markets. You are strongly advised not to trade with capital you cannot afford to lose. This article is neither a solicitation nor an offer to buy or sell securities.