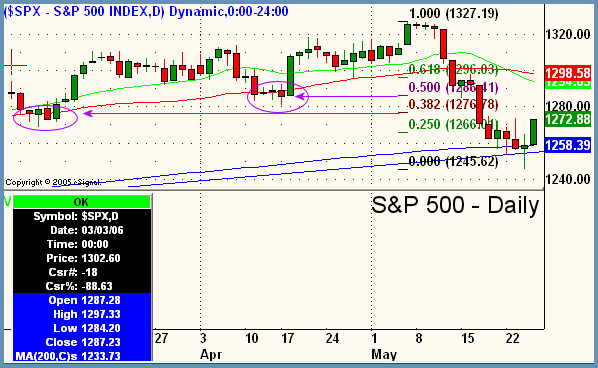
Good Morning, Traders. A first show of strength in the markets in some time on Thursday. However, those in the trenches watching all day would call it quite a snoozer. The Dow ended up 93.73 with the S&P gaining 14.31 and the Nasdaq 29.07, but it certainly didn't feel like it. An opening gap up on early morning economic data just ground sideways to higher for the entire day ensuing in the aforementioned gains. Breadth was positive on both exchanges, but overall volume contracted greatly, being down by over 22% on the NYSE and Nasdaq. This of course is not good news for those who are looking to the long side of things as we would have liked to see an increase in overall volume to show some signs of institutional accumulation on these increasingly rare up days. Given that the bounces have been weak as of late, today I offer up a daily chart of the S&P with Fibonacci retracment levels marked from the low to high of the recent down move. I find it interesting that the key levels of 38.2% and 50% (the most likely places where markets or stocks usually pivot before resuming trend), both lie very close to prior swing lows (circled in purple). This could be just one more chink in the bull's armor as we all know that areas that were bottoms before can often become tops when tested from the downside. If the overall volume patterns continue as they have, then odds are strong for another leg down in the near future. Keep a close eye on the circled areas in the S&P during Friday's trading.

Peter Reznicek is the Chief Equity Strategist and a principal of the Prana Fund, a domestic hedge fund, and ShadowTrader, a subsidiary of thinkorswim which provides coaching and education to its clients on both intraday and swing trading of equities. For a free trial to the full version of The Big Picture or to learn about ShadowTrader's other services, visit shadowtrader.net or send an email to preznicek@shadowtrader.net.