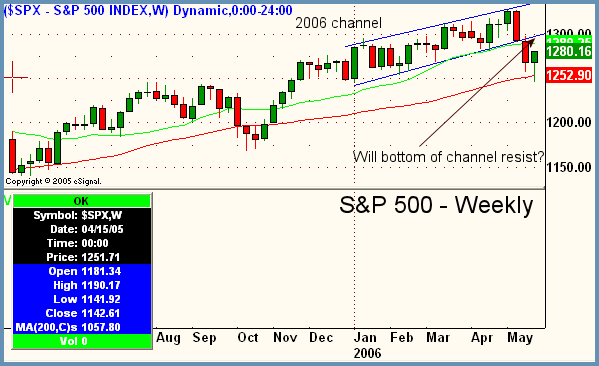
Good Morning, Traders. It's a holiday shortened week starting as we digest our hot dogs, burgers, beer, (burrrrp) and recent market action. Last week's pre-holiday trading was lackluster at best. Although we bounced three out of the five trading days, overall volume increased on only one of those days and on the other two it fell off drastically. So at first glance, it appears that the recent rally is of the dead cat variety. The chart below may give us some clues as to how far we will go to the upside from here and where the next pivot may be. The parallel blue lines enclosing most of the price action of 2006 below define what is known as a price channel. The way channels work is simply that when the lower band is tested, we get a bounce to the upper band and vice versa. As long as the channel lines remain intact, the trend is fine and it's smooth sailing. If, however, either channel line is broken then a radical shift usually occurs. Note that this can happen to either side and often signals a strong move. Look backwards into popular IBD 100 stocks of the last year that were the best performers of 2005. Very often you will see steady uptrends in a channel and then at some point (usually at the last stage breakout), there is a move outside of the upper band of the channel which becomes the parabolic blowoff top. Whenever prices break out of a channel pattern to either side, the line which was recently broken is often tested as prices rally back. This technical concept could be in play soon in the S&P. Note the nasty breakdown two weeks ago in the benchmark index that broke the lower end of the channel and also temporarily defined new lows for the year. The odds are that the recent strength in the S&P should continue at least to the 1300 area to touch where the bottom of the channel currently sits. Be careful out there. The Dow is the only one now of the "big three" that has not made new 2006 lows recently.

Peter Reznicek is the Chief Equity Strategist and a principal of the Prana Fund, a domestic hedge fund, and ShadowTrader, a subsidiary of thinkorswim which provides coaching and education to its clients on both intraday and swing trading of equities. For a free trial to the full version of The Big Picture or to learn about ShadowTrader's other services, visit shadowtrader.net or send an email to preznicek@shadowtrader.net.