NASDAQ Commentary
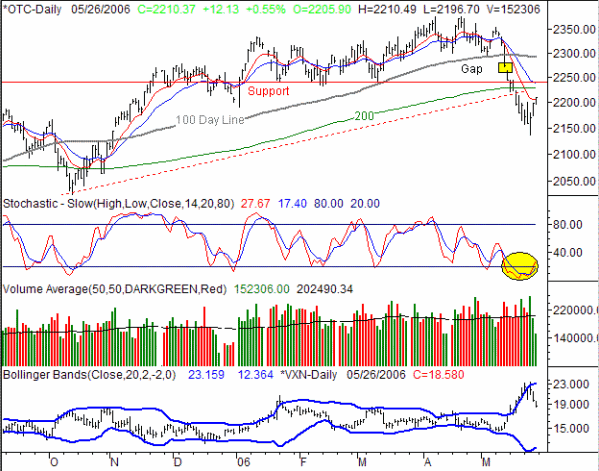
After a rough start, the NASDAQ Composite finally came to life and put up some positive numbers for the week. The close at 2210.37 was a 16.49 point (+0.75%) improvement over the previous Friday's close, and put the index back above the 10 day moving average. However, that's still far from being evidence of a full-blown recovery. In fact, the NASDAQ could go even higher and still be in a bigger downtrend. As it was last week, things are going to be tricky to navigate in the coming week.
Friday's 12.13 point gain left the composite right above the 10 day moving average. That's the first half of a two-part buy signal; the second half is a second and higher close above the 10 day line. So in that light, we have to at least acknowledge that there may be some new upward momentum developing. However, any of that bullishness is tainted now that the index has been damaged so badly. For instance, the NASDAQ is still under the 200 day line, as well as the 20 and 50 day lines. Plus, when you're as stochastically oversold as the composite was last week, you're bound to bounce a little. That - so far - is all we see.
We'll also point out that, even though the NASDAQ was rising over the last three days of the week, the volume behind those gains was shrinking (after that initial accumulation day on Wednesday).
So, we remain trapped between a rock and a hard place. Only a couple of closes above 2240 would get us thinking like bulls again. On the flipside, we'd need to see a close under the year-to-date low of 2135.81(hit last week) to add new bearish trades.
On a side note, the NASDAQ Volatility Index (VXN) pulled back sharply after a rocket-ride to 23.55. Now, at 18.58, it's in the middle of its Bollinger Bands, and pointed lower. That's technically bullish, but don't assume the VXN will have to get all the way back to the lower band (12.36) before bearish pressure sets in. Be sure to keep an eye on the VXN, taking note of any upside reversal bars. That may signal a downside move for the NASDAQ before it actually starts.
NASDAQ Chart

S&P 500 Commentary
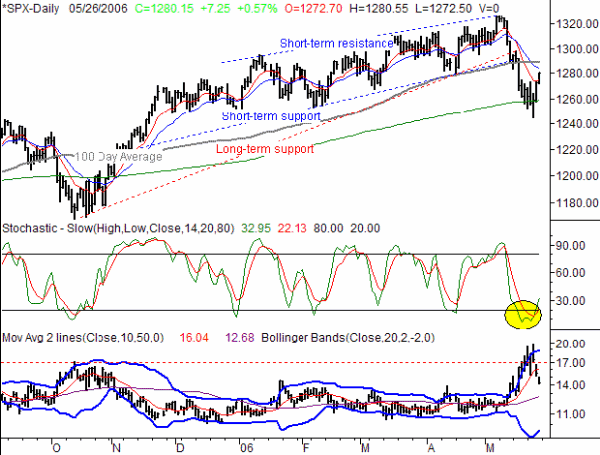
The S&P 500 outperformed the NASDAQ last week by gaining 1.03%. The 13.10 point net gain over the last five sessions left the large-cap index at 1280.15 on Friday, which was just above the 10 day moving average. But like the NASDAQ, it's still not clear if this was just the inevitable bounce following a 3.9% plunge, or if things really are getting bullish. More than that, we may not get an answer to that question right away.
Although the S&P 500 took a big hit too, it never really fell under the 200 day line in a significant way. In fact, the 200 day moving average was support, spurring the index higher in the latter half of next week. In fact, the push was strong enough to get the index back above its 10 day line too. That's the first half of a buy signal, but like the NASDAQ, we're still a little skeptical of any buy signals for the SPX. The fact of the matter is that the index was stochastically oversold, and the Volatility Index (VIX) was pushing its upper limits.
However, it's still under its 20 and 100 day line. So as with the NASDAQ, we need to see some more gains before we're convinced there's more upside fuel left. The resistance line to break is 1289, or the 100 day line. Support is the 200 day line, at 1258.65. We're neutral until one of those lines is broken, so be patient here.
S&P 500 Chart

Dow Jones Industrial Average Commentary
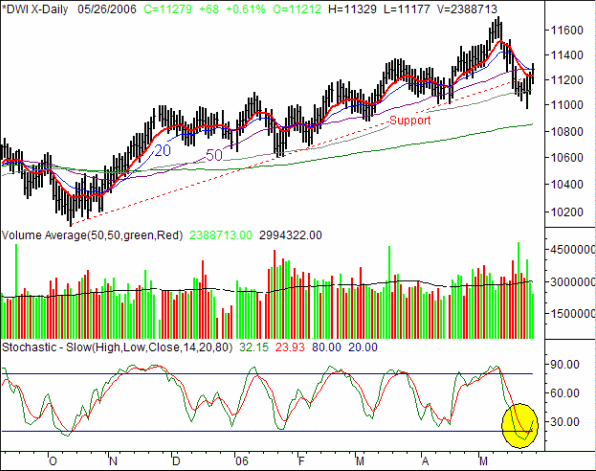
Although we were surprised to see stocks do as well as they did last week, we weren't surprised to see the Dow do better than the rest of the indices. Its 1.21% gain for the last five trading days leaves this blue-chip index in its current role as the leading anchor for the bulls. It closed at 11,279 on Friday, 135 points better than the previous Friday's closing level.
The Dow's relative strength has kept it in the best position to break above all of its key moving averages. In fact, it closed right at its combined 20 and 50 day lines on Friday, and well above its 10 and 100 day lines. So in that light, the Dow is still showing us general bullish momentum.
The downside potential is highlighted by the fact that Wednesday's low of 10,980 was the first lower low we've seen since October. Plus, an important support line was breached with the recent downward move. So even though things looked a whole lot better this past week, we don't want to jump the gun. Sit tight here - we'll have a more definitive idea for the Dow by next week.
Dow Jones Industrial Average Chart

Price Headley is the founder and chief analyst of BigTrends.com.