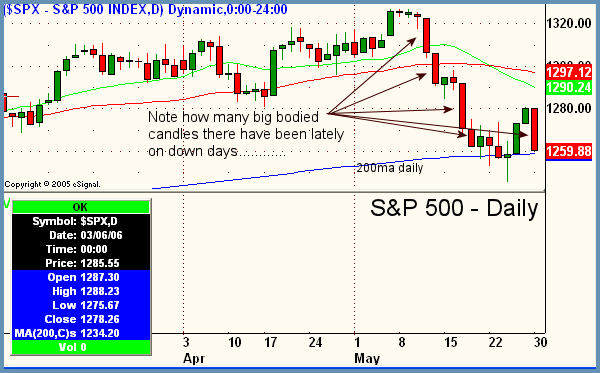
Good Morning, Traders. Wow, are the bears out in full force, or what?!? Over the weekend in the ShadowTrader Video Weekly we commented on the fact that of the three days that the market rose last week, overall volume fell drastically on two of those days. Generally when volume does not pick up at all during an upswing there is little chance of bottoming action turning into follow-through to the upside. Certainly Tuesday's trade confirms this lack of momentum in the aforementioned "bounce." All three major averages were down more than 1.5% yesterday, with the Nasdaq Composite taking it on the chin the worst (would we expect anything different by now?) of the three, losing 2.06% on the day. Always keeping in mind that internals are more important than "externals" as far as a market is concerned, Tuesday's action left little doubt over which group of market participants had the upper hand. NYSE breadth closed at over 8 to 1 negative (!) with a reading of 3.73:1 over on the Nasdaq in the same direction. Advance decline lines on both exchanges closed worse than -1500 and the NYSE trin broke out like a star to the upside (bearish) to close with a 2.40 reading at 4 p.m. ET. Novice traders should note that the TRIN is an inverse indicator and rises away froma parity level of 1.0 when things get bearish. Readings over 2.0, especially closes, are considered signs of strong selling into the close which is sometimes referred to as "professional hour" as opposed to the amateur hour at the open. Homebuilders, Broker-Dealers, Oil Services, and Internet stocks led the way for the decliners. As shown in the chart below, the market has now parked itself back on its 200ma daily (blue line). What's quite important now is to simply watch market action on a daily basis and analyze candle by candle. Analyze how much upward movement is erased by downward movement and how quickly. Do the down days result in large bodied red candles that indicate huge swells of bearish emotion? How do the up days look on daily bars?
Peter Reznicek is the Chief Equity Strategist and a principal of the Prana Fund, a domestic hedge fund, and ShadowTrader, a subsidiary of thinkorswim which provides coaching and education to its clients on both intraday and swing trading of equities. For a free trial to the full version of The Big Picture or to learn about ShadowTrader's other services, visit shadowtrader.net or send an email to preznicek@shadowtrader.net.


 Free Festival of Traders Videos